Large demographic shifts are reshaping America. The country is growing in numbers, it’s becoming more racially and ethnically diverse and the population is aging. But according to a new analysis by Pew Research Center, these trends are playing out differently across community types.
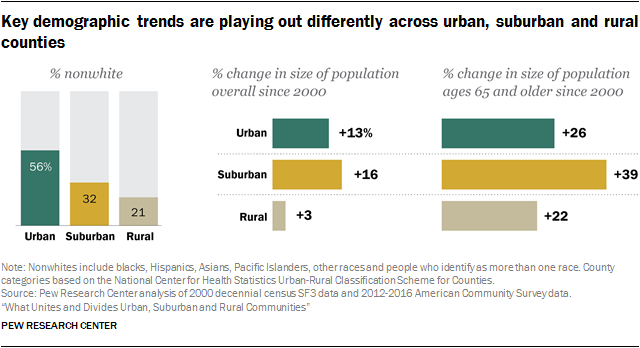
Urban areas are at the leading edge of racial and ethnic change, with nonwhites now a clear majority of the population in urban counties while solid majorities in suburban and rural areas are white. Urban and suburban counties are gaining population due to an influx of immigrants in both types of counties, as well as domestic migration into suburban areas. In contrast, rural counties have made only minimal gains since 2000 as the number of people leaving for urban or suburban areas has outpaced the number moving in. And while the population is graying in all three types of communities, this is happening more rapidly in the suburbs than in urban and rural counties.
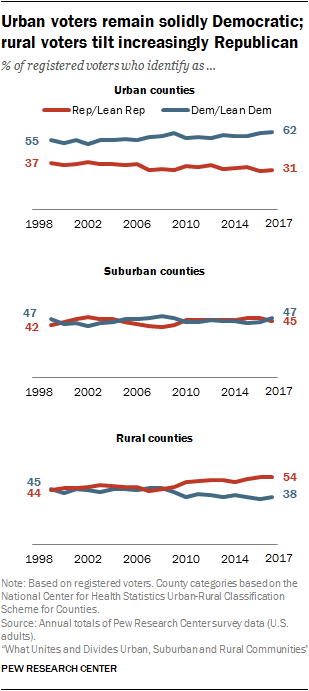
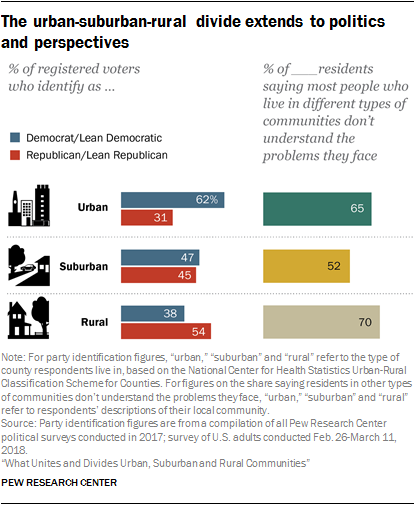 At the same time, urban and rural communities are becoming increasingly different from each other politically. Adults in urban counties, long aligned with the Democratic Party, have moved even more to the left in recent years, and today twice as many urban voters identify as Democrats or lean Democratic as affiliate with the Republican Party. For their part, rural adults have moved more firmly into the Republican camp. More than half (54%) of rural voters now identify with or lean to the GOP, while 38% are Democrats or lean Democratic.
 Against this backdrop, a new Pew Research Center survey finds that many urban and rural residents feel misunderstood and looked down on by Americans living in other types of communities. About two-thirds or more in urban and rural areas say people in other types of communities don’t understand the problems people face in their communities. And majorities of urban and rural residents say people who don’t live in their type of community have a negative view of those who do. In contrast, most suburbanites say people who don’t live in the suburbs have a positive view of those who do.
Defining ‘urban,’ ’suburban’ and ‘rural’
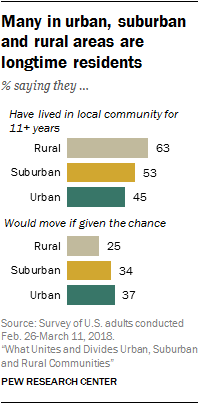 The divides that exist across urban, suburban and rural areas when it comes to views on social and political issues don’t necessarily extend to how people are experiencing life in different types of communities. Rural and suburban adults are somewhat more rooted in their local areas, but substantial shares in cities, suburbs and rural areas say they have lived in their communities for more than 10 years. And about six-in-ten in each type of community say they feel at least some sense of attachment to their communities, though relatively few say they are very attached.
 For adults who currently live in or near the place where they grew up – roughly half in rural areas and about four-in-ten in cities and suburbs – family ties stand out as the most important reason why they have never left or why they moved back after living away. And, when it comes to their interactions with neighbors, urban, suburban and rural residents are about equally likely to say they communicate with them on a regular basis.
In addition, urban and rural residents share some of the same concerns. Roughly equal shares of urban (50%) and rural (46%) residents say that drug addiction is a major problem in their local community. When it comes to the availability of jobs, rural adults are somewhat more likely to say this is a major problem where they live (42% say so), but a substantial share of urban dwellers (34%) say the same, significantly higher than the share in suburban communities (22%). Other problems – such as access to affordable housing in cities and access to public transportation in rural areas – are felt more acutely in some areas than in others.
The nationally representative survey of 6,251 adults was conducted online Feb. 26-March 11, 2018, using Pew Research Center’s American Trends Panel.1 It explores the attitudes and experiences of Americans in urban, suburban and rural areas, including their views on key social and political issues, how they see people in other types of communities, and how they’re living out their lives in their local communities. The survey sheds light on what divides and unites Americans across community types as well as on differences within urban, suburban and rural areas – sometimes driven by partisanship, sometimes by demographics. The study also includes a detailed analysis of demographic trends in urban, rural and suburban counties. Among the report’s key findings:
There are significant gaps in measures of economic well-being in urban, suburban and rural counties
 In addition to the divergent demographic trends taking place in urban, suburban and rural communities, the analysis finds that rural counties lag behind their urban and suburban counterparts when it comes to some measures related to economic well-being. The average earnings per worker in urban areas were $49,515 in 2016, followed by $46,081 in the suburbs and $35,171 in rural areas, though these figures don’t account for differences in living costs across county types. And while the number of employed adults ages 25 to 54 rose in urban and suburban counties since 2000, it declined in rural counties overall.
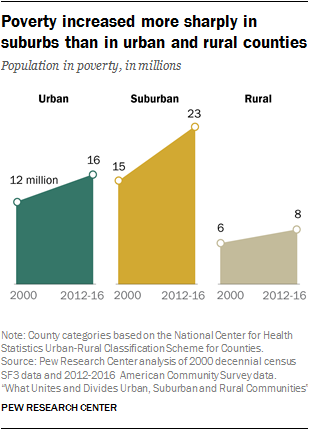
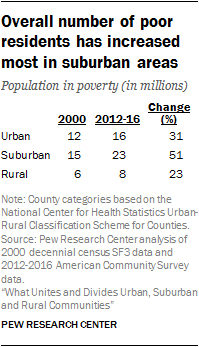
 When it comes to the number of people living in poverty, however, the suburbs have seen much sharper increases since 2000 than urban or rural counties – a 51% increase, compared with 31% in cities and 23% in rural areas. Overall, the poverty rate is somewhat higher in rural (18%) and urban (17%) areas than in suburban (14%) counties.
Rural Americans, especially those without a college degree, are less optimistic about their financial future
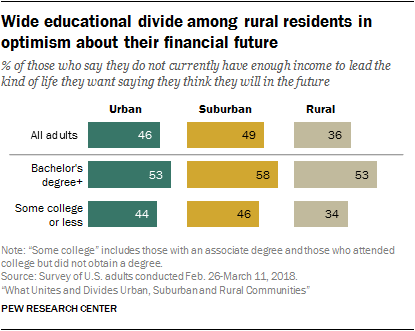 Majorities of Americans in urban (68%), suburban (59%) and rural (62%) communities say they don’t currently have enough income to lead the kind of life they want. But while about half of those in cities (46%) and suburbs (49%) who say this is the case believe they will have enough income in the future, rural residents are less optimistic: 63% of adults in rural areas who say they don’t currently have enough income to lead the kind of life they want don’t expect to in the future, while 36% think they eventually will.
 The gap in financial optimism across community types is driven by a marked concern among rural residents without a bachelor’s degree. In rural areas, about a third (34%) of those with some college or less education who say they don’t currently have enough income to lead the kind of life they want think they will in the future; higher shares in cities (44%) and suburbs (46%) say this is the case. In contrast, similar shares of those with a bachelor’s degree or more education in urban (53%), suburban (58%) and rural (53%) areas think they will eventually have enough income to lead the kind of life they want.
Across community types, majorities say rural areas get less than their fair share of federal dollars
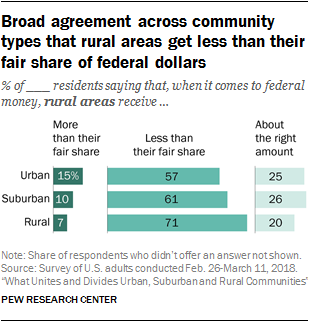 About seven-in-ten rural residents (71%), and somewhat narrower majorities in suburban (61%) and urban (57%) communities, say rural areas receive less than their fair share of federal dollars. These views don’t vary considerably across demographic or partisan lines.
 When it comes to the amount urban areas receive from the federal government, about half of urban dwellers (49%) say cities receive less than their fair share; only about a third of those in suburbs and rural areas share this view. Across community types, Democrats are more likely than Republicans to say urban areas receive less than their fair share, while Republicans are more likely to say these types of communities receive more than their fair share. Similar shares of Democrats and Republicans within each community type say urban areas receive about the right amount of federal dollars.
About six-in-ten rural residents say the values of urban dwellers don’t align with theirs; 53% of urban residents say the same about the values of those in rural areas
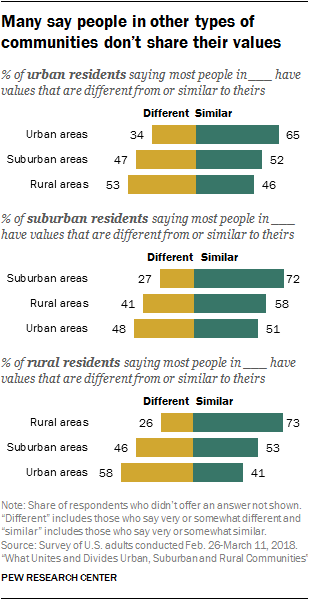 Most Americans say people who live in the same type of community as they do generally share their values, but they are less convinced that those in other types of communities do. For example, a majority of rural residents (58%) say the values of most people in urban areas are very or somewhat different from theirs.
 Among urban dwellers, 53% see an urban-rural divide on values, while 46% say most people in rural areas have values that are similar to their own. About half in urban and rural areas say most people in suburbs share their values, while suburbanites are somewhat more likely to say most people in rural areas have values that are similar to their own (58%) than to say the same about those in urban areas (51%).
There’s a clear political dimension to these attitudes. For example, majorities of Republicans in urban (64%) and suburban (78%) communities say most people in rural areas share their values, while about six-in-ten Democrats in these communities say the values of most rural residents are different from theirs.
Conversely, Democrats in suburban and rural areas are far more likely than their Republican counterparts to say most people who live in cities share their values. Even among Republicans who live in urban areas, only about half (48%) say most people who live in cities share their values.
Urban and rural Americans differ sharply in their views of some key social and political issues, but in some cases this has more to do with partisanship than geography
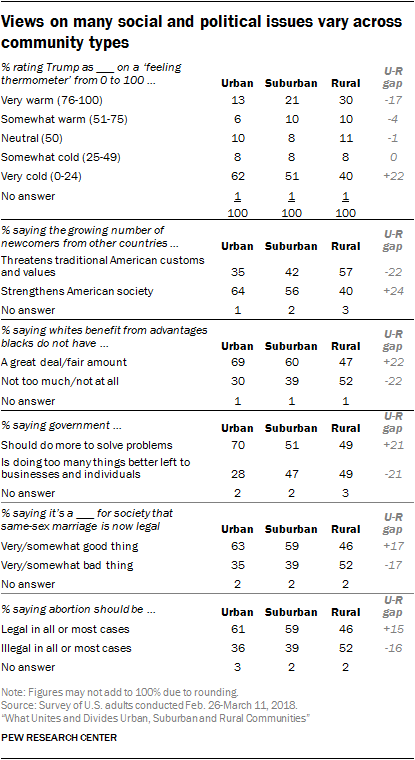
 Americans in urban and rural communities have widely different views when it comes to social and political issues, including their assessments of President Donald Trump and opinions about race, immigration, same-sex marriage, abortion and the role of government.
 In many cases, the differences between urban and rural residents can be attributed to the fact that rural areas tend to have a higher concentration of Republicans and Republican-leaning independents, while majorities in urban communities identify with or lean toward the Democratic Party. For example, while urban dwellers are far more likely than their rural counterparts to say abortion should be legal in all or most cases, that the government should do more to solve problems, and that whites benefit from advantages in society that black people do not have, these differences shrink when partisanship is taken into account. In other words, Democrats across community types share similar views on these issues, as do Republicans in urban, rural and suburban areas.
On other issues, differences across community types remain, even after controlling for partisanship. Rural Republicans are more likely than Republicans in urban areas to say the legalization of same-sex marriage is a bad thing for society, and they are also more likely to express very positive views of Trump. In turn, Democrats across community types express different views on immigration, with those in urban areas more likely than their rural counterparts to say the growing number of newcomers strengthens American society.
Seven-in-ten urban dwellers – vs. about half in rural areas – say it’s important to them to live in a community that is racially and ethnically diverse
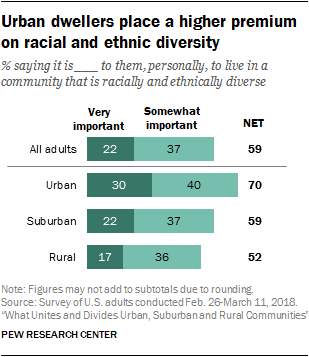 Rural residents are far more likely than their suburban and urban counterparts to say that, as far as they know, all or most of their neighbors are the same race or ethnicity as they are (69% vs. 53% and 43%, respectively). And urban residents place a much higher priority on living in a community that is racially and ethnically diverse than do those in suburban and rural areas: 70% of city dwellers say this is very or somewhat important to them, compared with a narrower majority of those in suburbs (59%) and about half in rural areas (52%).
 Across community types, relatively few say all or most of their neighbors share their political views: About a quarter in urban (25%) and rural (24%) communities and 19% in the suburbs say this is the case. Perhaps not surprisingly, given the political makeup of urban and rural communities, majorities of Republicans in cities (59%) and Democrats in rural areas (57%) say only some or none of their neighbors share their political views.
Living among politically like-minded people is not a top priority for most Americans: Only one-in-ten or fewer in urban (10%), suburban (8%) and rural (6%) communities say it is very important to them personally to live in a community where most people share their political views. Still, many say this is at least somewhat important to them (46%, 43% and 38%, respectively).
Urban and rural residents see drug addiction as a top-tier problem in their local community
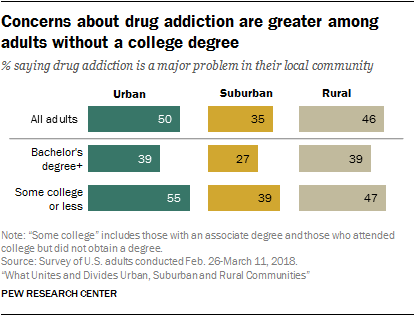 About half of urban (50%) and rural (46%) adults say drug addiction is a major problem where they live; a smaller but substantial share in the suburbs (35%) say the same about their local community.
 Concerns about drug addiction vary significantly along socio-economic lines. Across community types, those without a bachelor’s degree are more likely than those with more education to say drug addiction is a major problem in their local community.
Certain problems are felt more deeply in some types of communities than in others. For example, rural adults are more likely than their urban and suburban counterparts to say access to public transportation and to high-speed internet are major problems. For their part, urban dwellers express greater concern than those in suburban and rural areas about the availability of affordable housing, crime, poverty and the quality of K-12 education in public schools.
About four-in-ten U.S. adults live in or near the community where they grew up
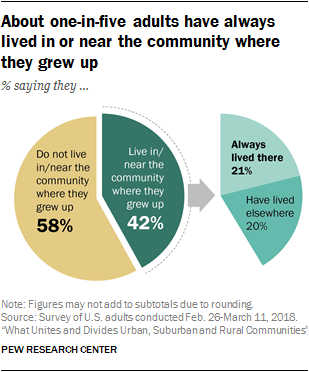 About half of rural residents (47%) say they live in or near the community where they grew up, including about a quarter (26%) who say they have always lived there. Among those in urban and suburban areas, about four-in-ten say they currently live in or near the community where they grew up (42% and 38%, respectively), with about one-in-five in each saying that has always been the case.
 In urban, suburban and rural areas, more point to family ties than to any other factor as one of the main reasons why they stayed in the community where they grew up or why they left and later returned. About four-in-ten of those who left and came back (42%) and 35% of those who have lived in or near the same community their entire lives say they have done so to be near family. For both groups, factors related to the quality of life in the community, such as the cost of living, the climate, amenities, schools, or the sense of community, are the second most-cited reasons; 22% of those who left and returned and 17% of those who never left point to these factors.
About half of adults who have always lived in or near the community where they grew up (52%) say all or most of their extended family members live within an hour’s drive from them, compared with 38% of those who moved away and returned, and even smaller shares of those who don’t live in or near the community where they grew up (17%).
Across community types, relatively few say they feel very attached to the community where they live
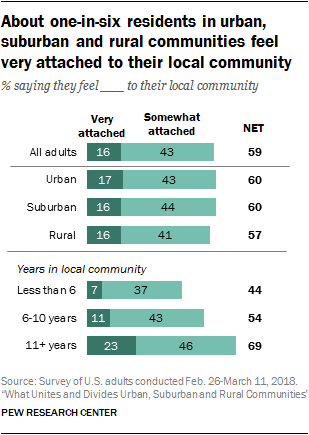 A majority of Americans (59%) say they feel some attachment to their local community, but only 16% say they feel very attached; 41% say they are not too or not at all attached to the community where they live. Adults in urban, suburban and rural areas report nearly identical levels of attachment to their local community.
 In each of the three types of communities, those who have lived in their community for more than a decade and who have made connections with their neighbors are the most likely to feel a sense of attachment. About seven-in-ten adults who have lived in their community more than a decade (69%) say they feel very or somewhat attached to their local community, compared with 54% of those who have lived in their community six to 10 years and 44% of those who have done so less than six years. And while 77% of those who say they know all or most of their neighbors say they feel attached to their local community, a narrower majority of those who know some of their neighbors (55%) and about a third of those who don’t know any of their neighbors (32%) say the same.
Smaller shares of adults in rural areas than in cities and suburbs say they’d like to move away
 About a third of U.S. adults (32%) say they would want to move to a different community if they could, while 37% say they would not want to move and 31% aren’t sure. One-in-four rural residents say they would move if given the chance, compared with 37% of those in urban areas and 34% of suburbanites. Among adults younger than 30, however, about an equal share in urban (42%) and rural (39%) areas say they would move if they could; 48% of young adults in the suburbs say the same.
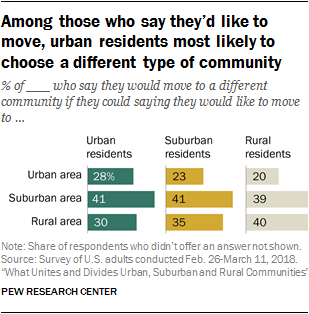
 Among those who say they would want to move, many, particularly in suburban and rural areas, say they would like to stay in the same type of community. For example, about four-in-ten adults in the suburbs who would like to move (41%) say they would choose to move to another suburban community. Similarly, 40% of those in rural areas who report they would like to move say they would move to another rural community.
Among urban dwellers who say they would like to move, similar shares say they would like to stay in an urban area (28%) as say they would like to move to a rural community (30%). About four-in-ten (41%) would like to move to the suburbs.
Rural residents are more likely than those in cities or suburbs to say they know all or most of their neighbors, but no more likely to interact with them
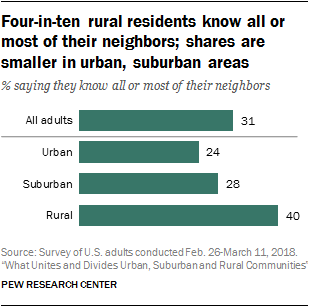 Four-in-ten adults in rural communities say they know all or most of their neighbors, compared with 28% in the suburbs and 24% in urban areas. However, among those who know at least some of their neighbors, rural Americans are no more likely than their urban and suburban counterparts to say they interact with them on a regular basis.
 About half of adults who know at least some of their neighbors in urban (53%), suburban (49%) and rural (47%) communities say they have face-to-face conversations with a neighbor at least once a week. Other forms of communication, such as exchanging emails or text messages or talking on the phone with neighbors, are less common: About one-in-five or fewer in urban, rural and suburban areas say this happens at least once a week.
Americans are generally trusting of their neighbors, but those in suburban and rural areas are more so. For example, about six-in-ten of those in the suburbs (62%) and in rural communities (61%) say they have a neighbor they would trust with a set of keys to their home, compared with about half (48%) in urban areas.
There is little variation among those living in different types of communities in the share reporting they have social support, feel optimistic about their lives or feel lonely. And the idea that life in the city feels more hectic than life in the country is not borne out by the data – only about one-in-ten urban, suburban and rural residents say they always or almost always feel they are too busy to enjoy their lives.
Demographic and economic trends in urban, suburban and rural communities
 Three key demographic forces have reshaped the overall U.S. population in recent years: growing racial and ethnic diversity, increasing immigration and rising numbers of older adults. But these trends are playing out differently in the nation’s rural, urban and suburban communities, touching some more than others.
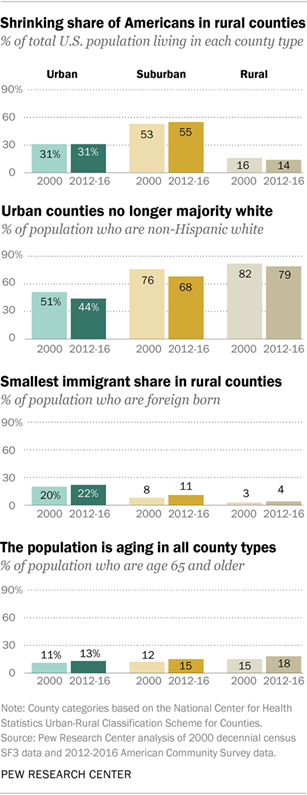
 Likewise, recent U.S. population growth also has been uneven. Urban counties have grown at roughly the overall national rate of 13% since 2000. Suburban and small metropolitan areas have grown more briskly. Rural counties have lagged, and half of them have fewer residents now than they did in 2000.
According to a Pew Research Center analysis of census data, since 2000, U.S. urban and suburban populations have grown at least as much as they did over the prior decade. But the total rural population has grown less than it did in the 1990s, when rising numbers fed hope of a modest “rural rebound.” As a result, a somewhat smaller share of Americans now live in rural counties (14% vs. 16% in 2000).
More recently, the Census Bureau’s population estimates for 2017 show a one-year uptick in the nation’s rural population, though not enough to make up for previous declines. Analysis by demographer Kenneth M. Johnson attributed the increase to gains in rural communities on the edge of metropolitan areas, while more remote counties continued to lose population.
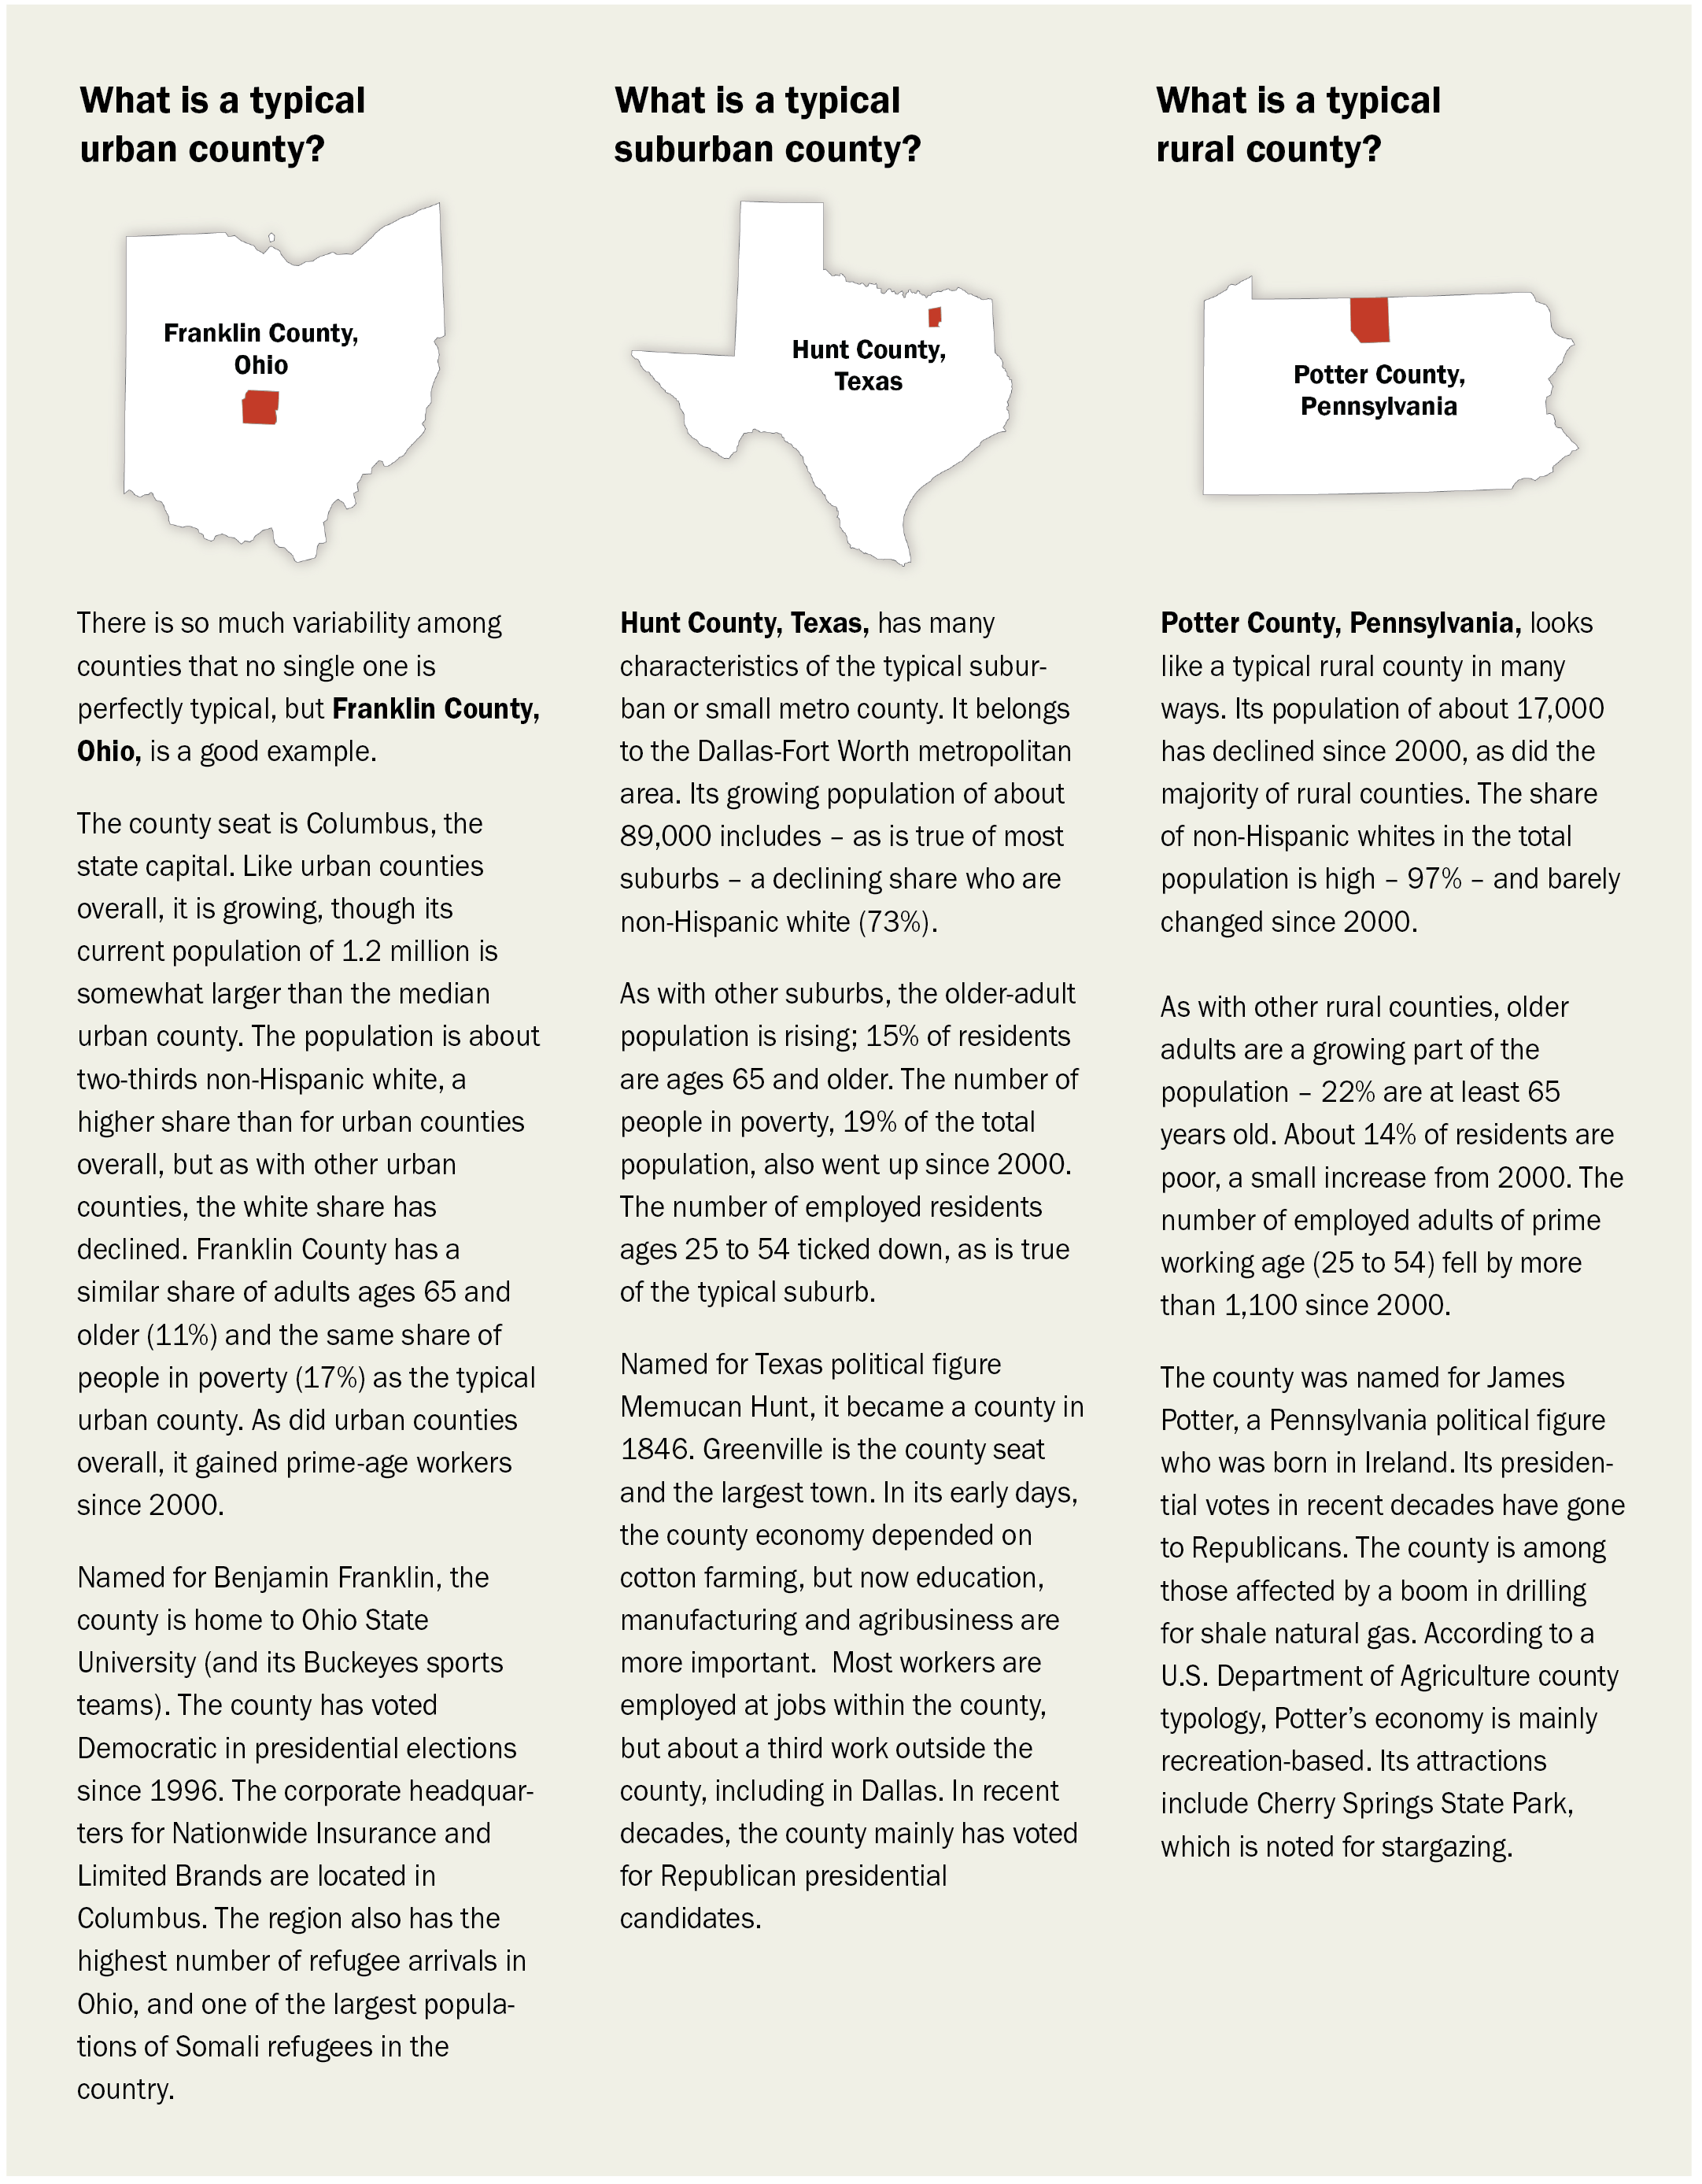
What is an urban, suburban or rural county?
The flow of people in and out of different types of U.S. counties is affecting their size and composition. Since 2000, more people left rural counties for urban, suburban or small metro counties than moved in from those areas. Because there were not enough new immigrants to offset those departures, rural counties as a group grew only because they had more births than deaths.
At the national level, non-Hispanic whites make up the majority of the population, but a key demographic shift is underway: Whites are a shrinking share of the population and expected to be less than half by midcentury as other groups grow more rapidly. Whites have become a minority of the population in most urban counties since 2000, while remaining the majority in 90% of suburban and small metro counties and 89% of rural ones.
Another key demographic trend, the rise in immigration in recent decades, has raised the foreign-born share of the U.S. population overall and has increased the share in each type of county, although to varying degrees. Immigrants, along with their children and grandchildren, have accounted for the majority of U.S. population growth since 1965. But immigrants are more concentrated in cities and suburbs than in rural areas. On the flip side, the majority of rural counties now have fewer U.S.-born residents than in 2000, a key factor in their dwindling populations.
 A third major population driver – the aging of the giant Baby Boom generation – also has varying impacts on different county types. Rural areas have a higher share of adults who are ages 65 and older than urban or suburban counties. But suburban counties have experienced the sharpest increases in the number of older adults since 2000.
 The analysis in this chapter relies mainly on Census Bureau data. Current numbers for county characteristics come from the American Community Survey (ACS) combined data for 2012-2016, the latest available. Current numbers for natural increase/decrease and migration flows come from population estimates for 2014, the most comparable year to the ACS data because it is the midpoint of the combined ACS data used in this chapter. See Methodology for more detail.
Suburbs growing more rapidly than rural or urban areas
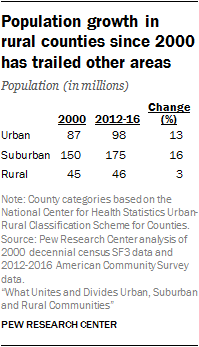 About 46 million Americans live in the nation’s rural counties, 175 million in its suburbs and small metros and about 98 million in its urban core counties.
 As a group, the population in rural counties grew 3% since 2000, less than their 8% growth in the 1990s. Urban county population rose 13% since 2000 and the population in suburban and small metro counties went up 16%, growth rates somewhat higher than in the 1990s.2 The share of U.S. residents who live in rural counties declined in the 1990s and since 2000, but rose in suburban counties during both periods and held steady in urban counties.
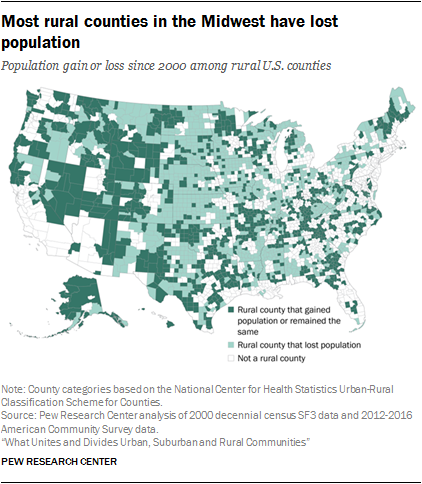
Although the rural population as a whole has grown since 2000, the majority of populations in individual rural counties have not. Since the turn of the century, the population declined in 52% of rural counties – 1,024 of 1,969. Among the hardest hit counties were those where the economy is based on farming, about a fifth of rural counties.
Growth factors vary for cities, suburbs and rural areas
There are four main drivers of population gain or loss at the county level: births, deaths, new immigrants coming from abroad or leaving, and people moving to or from other U.S. counties (including immigrants already living in the U.S.). The census numbers show that these factors are affecting cities, suburbs and rural communities differently.
Urban areas gained 1.6 million net new migrants since 2000, with a surplus of immigrants more than offsetting a loss of people who moved out to suburbs or rural areas. As a group, urban counties had 9.8 million more births than deaths, further bolstering their populations.

Suburban and small metro counties have grown since 2000 because of gains in all the drivers of population change. They gained 11.7 million new residents by drawing former residents of U.S. urban and rural areas, as well as immigrants from abroad. On top of that, they had 12.1 million more births than deaths.
It was a different picture for rural counties, however, where move-outs since 2000 exceeded move-ins. As a group, they had a net loss of 380,000 people who moved out. The loss would have been larger – more than 950,000 people – had it not been partly offset by about 600,000 new immigrants. The total population of rural counties grew only through natural increase – that is, they had 1.2 million more births than deaths.
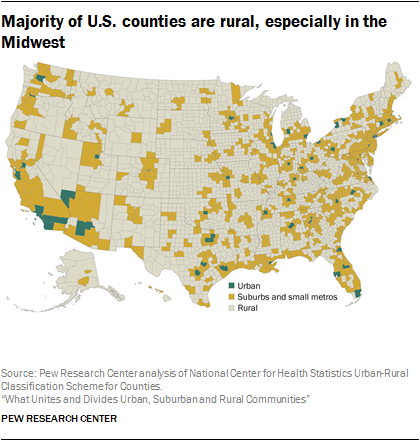
Rural population loss largest in Midwest
 Patterns of births, deaths, migration and immigration vary greatly among regions, and generally illustrate the long-term trend of Americans favoring the Sunbelt states of the South and West over Northeastern or Midwestern states. These regional differences persist within each county type.
 Among rural counties, a majority in the Northeast and Midwest lost population since 2000, while a majority in the South and especially the West gained population. One factor behind the regional difference is that rural counties in the Northeast and Midwest were more likely than other rural areas to have more deaths than births. These counties also were more likely to have experienced a net loss of migrants – more people moving out than moving in.
The population trends of rural counties are linked to their economic profiles.3 As a group, the nation’s 391 rural farming counties – heavily concentrated in the Great Plains – have lost total population since 2000, while rural counties with other types of economies gained population.
 The total population of rural counties with recreation-based and government-based economies grew more since 2000 than the populations of other rural county types. One reason recreation-based counties grew was that they had a net gain of new residents who moved from other U.S counties, the only rural county type to have a gain in net domestic migration. An analysis by the Population Reference Bureau found that rural recreation-based counties were especially likely to have growing numbers of residents 65 and older, while rural farming-based counties were losing residents in that age group.
 Among urban areas, the Midwest had the largest share of population-losing counties since 2000: 42% of urban counties in this region, including the ones that encompass Chicago (Cook County, Illinois), Detroit (Wayne County, Michigan), and Cleveland (Cuyahoga County, Ohio), lost population.
Among suburban and small metro counties, about a quarter of the ones in the Northeast and Midwest lost population since 2000, a higher share than in other regions. A majority of Northeast and Midwest suburban counties had a net gain of migrants, but that was mainly due to immigration. A majority had a net loss of residents to urban or rural U.S. counties during this period.
Older adults are a higher share of the population in rural areas than in urban and suburban counties
 A key demographic trend shaping the makeup of local populations, as well as the nation as a whole, is the rising number of older Americans. The Baby Boom generation, born between 1946 and 1964, began turning 65 in 2011, and all will have reached that age by 2030.
While the population is aging in all three county types, this is happening more rapidly in U.S. suburban and small metro counties. The 65-and-older population grew 39% in the suburbs since 2000, compared with 26% in urban and 22% in rural counties.
Nationally and in each county type, the older adult population grew more sharply since 2000 than any other age group – young children, school-age children, young adults or middle-aged adults. In rural areas, the population younger than 18 declined during this period. As a result, in each county type, adults ages 65 and older now make up a larger share of the total population than in 2000.
As a group, rural counties skew older than suburban and urban counties: 18% of rural residents are 65 or older vs. 15% in suburban and small metro counties and 13% in cities.
Rural counties also have a smaller share of young adults than urban or suburban populations.
Urban and suburban counties are becoming more racially and ethnically diverse at a much faster pace than rural counties
 The nation is becoming more racially and ethnically diverse, but these changes have been more muted in rural counties compared with urban and suburban ones. The white share of the population fell 8 percentage points since 2000 in the suburbs, 7 points in the urban core and only 3 points in rural counties.
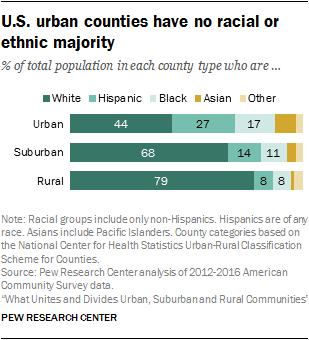
 Overall, the U.S. population remains majority white, but not so in urban areas as a group. Among urban residents, 44% are white, compared with 68% in suburban and small metro counties and 79% in rural counties. In fact, whites have become the minority in most urban counties (53% of them are majority nonwhite) since 2000; only about one-in-ten suburban (10%) and rural (11%) counties are majority nonwhite.
While the share of the non-Hispanic whites has declined, the number of whites grew in the nation overall – and in suburban counties as a whole – since 2000. But the white population did not grow as sharply as other groups did, leading to a decline in the white share of the total U.S. and suburban populations.
In urban counties, the decline in the share of the white population was due both to a decrease in the number of whites and an increase in the size of other populations, chiefly Hispanics.
In rural counties, the white population also decreased and other groups also increased in size, but the impact was more modest on the white share of the population because whites are so large a proportion of rural residents.
Immigrants are a rising share of the population in each county type
 The foreign-born population is not evenly distributed across county types; immigrants tend to be concentrated in big metropolitan areas. In fact, about half live in urban counties, where they make up a higher share of the total than in suburban or rural counties.
 The immigrant share of the population grew since 2000 in the nation as a whole and in each county type. Immigrants were responsible for a larger share of overall growth in rural (37%) and urban (38%) counties than in suburban (26%) ones.
Although rural counties as a group have more U.S.-born residents than in 2000, the majority of individual rural counties have fewer U.S.-born residents than in 2000. There is a large overlap between rural counties that have fewer U.S.-born residents than in 2000 and those that have fewer total residents than in 2000. In the vast majority of rural counties that lost population – 1,011 out of 1,025 – the number of U.S.-born residents declined, and there were not enough new immigrants to offset the loss.
There are gaps in poverty, education and employment across county types
In addition to the three major demographic shifts that are reshaping urban, suburban and rural counties in the U.S. – the aging of the population, changing racial and ethnic makeup and the influx of new immigrants – there are significant differences in other important metrics across community types. These relate to the economic well-being of their residents.
Poverty has increased more sharply in suburbs than in urban or rural counties
 Overall, the poverty rate is somewhat higher in rural (18%) and urban (17%) counties than in suburban ones (14%). Poverty rates have risen in all three county types since 2000.
 The number of people living in poverty also has risen across community types, but the size of the poor population rose more sharply in suburban counties than in urban or rural ones.
About half the U.S. poor population (49%) lives in suburban and small metro counties, while 34% live in cities and 17% in rural areas.
But looking at the share of counties where at least a fifth of the population is poor – a measure known as concentrated poverty – rural areas are at the top. About three-in-ten rural counties (31%) have concentrated poverty, compared with 19% of cities and 15% of suburbs. The number of counties with concentrated poverty grew for all three county types since 2000.
Growing share of residents of all county types have college degrees
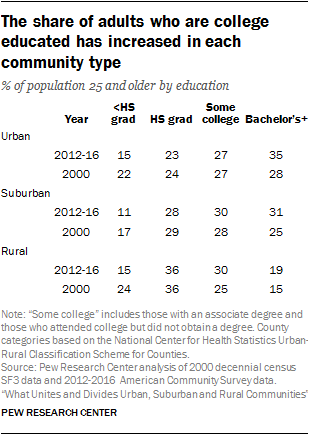 Growing shares of residents ages 25 and older have graduated from college in all types of U.S. communities since 2000, though growth since 2000 was not as sharp as during the 1990s. Rural communities lag in the share of the population with a college degree.
 Today, 35% of urban residents and 31% in the suburbs have a bachelor’s degree or more education, compared with 19% in rural counties. Rural areas also trail urban and suburban areas in their share of residents with postgraduate degrees.
In urban and suburban counties overall, college graduates outnumber residents with a high school diploma and no further education, but in the total rural population there are more high school graduates than college graduates. The share of residents who did not graduate from high school has dwindled in all three county types.
Rural counties lost prime-age workers, while urban and suburban areas gained them
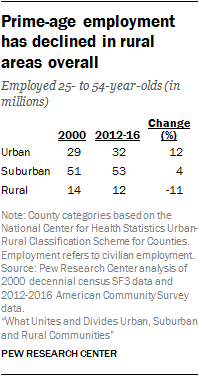 Rural counties also trail other types of communities, especially urban counties, on key measures of employment of prime-age workers – those 25 to 54 years old. For example, 71% of rural residents of prime working age are employed, compared with 77% in both urban and suburban counties.
 The number of employed adults in this age group (as well as the total number of prime working-age residents, employed or not) rose in urban areas as well as in suburban and small metro areas since 2000, but declined in rural counties overall. Rural counties now are home to a smaller share of the nation’s prime-age workers than in 2000.
The growth in the prime-age working population was particularly sharp in urban areas. As a result, urban counties now are home to a larger share of the nation’s prime-age workers than in 2000.
In suburban areas, which also saw an increase in the number of prime-age workers since 2000, the picture looks somewhat less rosy when analyzed through another lens – the experience of individual counties. Although the number of these workers grew for suburban counties as a group, a majority of suburban counties (59%) have fewer of them than in 2000. Among rural counties, 88% lost prime-age workers since 2000. Only 29% of urban counties did.
 Another measure of economic health – average earnings per worker – is highest in urban counties and lowest in rural ones. These average earnings are lower now than in 2000 for all county types, reflecting lingering effects of the 2007-2009 recession, though average earnings in rural areas declined the least. (This more recent measure is based on a five-year average centered on 2014, reflecting earnings for the prior year. The 2000 figure reflects 1999 earnings.)
 Urban, suburban and rural residents’ views on key social and political issues
 As urban and rural communities are becoming more distinct along demographic lines, they are also becoming more polarized politically. Americans in urban and rural communities have widely different views when it comes to social and political issues. From feelings about President Donald Trump to views on immigration and same-sex marriage, there are wide gaps between urban and rural adults.
 While these differences have been widely documented, the survey finds that, on some issues, they can be attributed to differences in the partisan composition of urban, suburban and rural areas, rather than in viewpoints that are rooted in a particular type of community. Rural areas tend to have a higher concentration of Republicans and Republican-leaning independents, while a majority of Americans in urban communities identify as Democrats or lean toward the Democratic Party. These patterns have become more pronounced over the past two decades as rural areas have moved in a Republican direction and urban counties have become even more Democratic. Americans who live in the suburbs are about evenly divided in their partisan loyalties, and that has generally been the case in recent decades.
 When it comes to abortion rights, the significant gap in attitudes between urban and rural residents – 61% of those in urban areas compared with 46% in rural areas say abortion should be legal in all or most cases – virtually disappears after controlling for party. Similar shares of Republicans in urban, suburban and rural communities express this view, as do nearly equivalent shares of Democrats in urban and rural communities.
 A similar pattern can be seen on the question of whether the economic system unfairly favors powerful interests, or if it is generally fair to most Americans. Overall, urban residents are more likely than those living in rural areas to say the economic system is unfair, but that difference is not notable within party groups.
The same can be said of views on the country’s changing demographics. Across community types, views are similar within the Republican and Democratic coalitions on the issue of nonwhites making up a majority of the population in the future, despite differences among urban, suburban and rural residents overall.
In some cases, however, differences across community types remain even after taking partisanship into account. For example, rural Republicans are more likely than Republicans living in urban areas to say the recent legalization of same-sex marriage is a bad thing for the country.
Urban and rural Republicans have somewhat different views on Trump
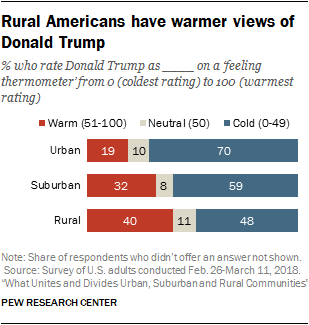
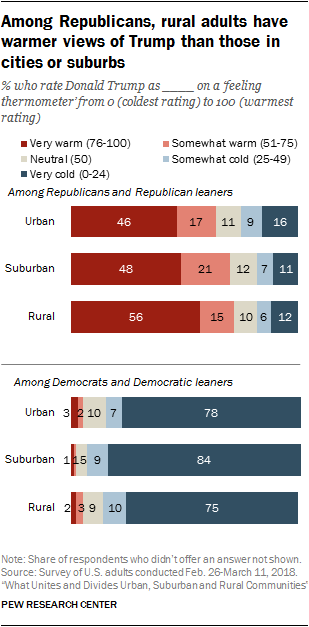 Asked to rate President Trump on a “feeling thermometer” ranging from 0 to 100, a majority of Americans give Trump a very cold (51%) or somewhat cool (8%) rating, while 10% rate him a neutral 50 on the 0-100 point thermometer. By contrast, 31% of Americans give him a very warm (22%) or somewhat warm (9%) rating.
 Trump’s ratings are particularly warm in rural areas, where four-in-ten rate him warmly. By contrast, 19% of people in urban areas give Trump a warm rating.
These differences by community type remain, even after controlling for party. Among Republicans, 56% of rural residents give Trump a very warm rating, compared with 48% of suburban and 46% of urban Republicans.
Within the Republican coalition, there are significant age gaps in views of Trump. In the suburbs, the share rating Trump very warmly is substantially higher among Republicans ages 50 and older (57%) than among Republicans younger than 50 (38%).
This gap persists among rural Republicans, a group largely considered central to Trump’s base. Younger rural Republicans are less likely than their older counterparts to rate Trump very warmly (44% vs. 66%).
Among Democrats, community type differences are more modest: 84% of suburban Democrats give President Trump a very cold rating, compared with 78% of urban Democrats and 75% of rural Democrats. And across community types, age plays less of a role in Democrats’ views of Trump than among Republicans.
Similarly, views of Barack Obama are divided by community type within parties: 70% of Republicans in urban areas give Obama a cold rating, compared with 78% of Republicans in rural areas. And urban Democrats are more likely to give Obama a warm rating (83%) than rural Democrats (72%).
Urban Republicans are more evenly split on social issues than rural Republicans
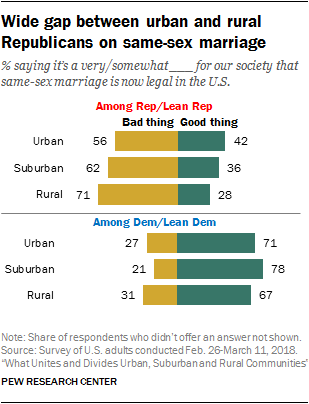 On the issue of same-sex marriage, the parties have long been divided. Still, controlling for partisan differences, the urban-rural divide persists on this issue. While 71% of rural Republicans say the legalization of same-sex marriage is a bad thing for the U.S., Republicans in urban areas are significantly less likely to say the same (56%).
 Among Democrats, there is less of a distinction. Urban and rural Democrats largely agree on the issue of same-sex marriage (71% of urban Democrats and 67% of rural Democrats say it is a good thing). Suburban Democrats have a somewhat more favorable view (78% say this is a good thing).
A similar pattern can be seen in views of societal priorities when it comes to marriage and family. Respondents were asked which of the following statements came closer to their own views, even if neither is exactly right: Society is better off if people make marriage and having children a priority, or society is just as well off if people have priorities other than marriage and children.
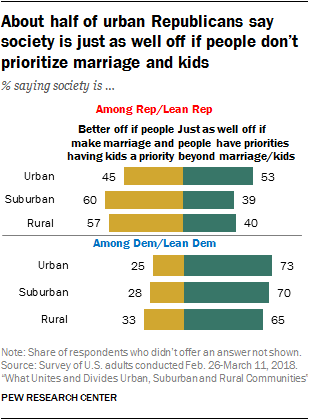 Among Republicans, there is a wide gap by community type. Urban Republicans are split, with 53% saying society is just as well off if people have other priorities than marriage and kids and 45% saying society is better off if people prioritize marriage and kids. By contrast, majorities of rural (57%) and suburban (60%) Republicans say the latter.
 Among Democrats, views on immigration differ by community type
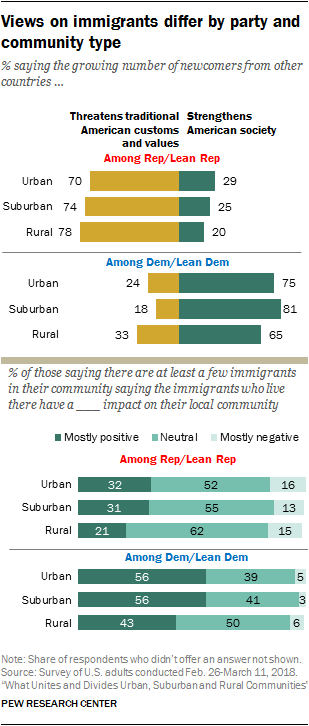 As the immigrant share of the U.S. population nears a historic high, Americans are largely divided by party and community type when it comes to views of immigrants. Among Democrats, those in urban (75%) and suburban areas (81%) are more likely than those in rural areas (65%) to say the growing number of newcomers strengthens American society rather than threatening traditional American customs and values.
 Differences on this question within the Republican coalition are more modest: 78% of rural Republicans say the growing number of newcomers threatens traditional American customs and values. This compares with 74% of suburban Republicans and 70% of urban Republicans. Relatively few Republicans, across community types, say immigrants strengthen the country.
When asked about the impact immigrants are having on their own community, a similar pattern emerges, with Democrats divided across community types. Among those who say there are at least a few immigrants in their local community, 56% of urban Democrats say their impact is mostly positive, compared with 43% of rural Democrats.
Overall, urban and suburban residents are more likely than those living in rural areas to say there are immigrants living in their local community, but even among rural residents the vast majority – 79% – say there are at least a few.
Beyond partisanship, large racial, gender and generational gaps exist within communities on key issues
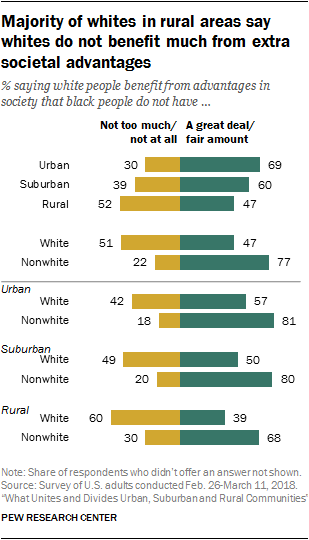 Depending on the type of community in which Americans live, views differ sharply on whether white people in the U.S. benefit from advantages in society that black people do not have.
 Americans living in rural areas are roughly evenly divided: 52% say whites do not benefit too much or at all from advantages in society that black people do not have, and 47% say they benefit a great deal or a fair amount. By contrast, three-in-ten people living in urban areas say whites do not benefit from societal advantages; 69% say they do.
Overall, the views of whites differ sharply from those of nonwhites on this issue.4 While about half (51%) of whites say people in their racial group do not benefit from societal advantages, just 22% of nonwhites agree.
The racial gap persists across all three community types. White rural residents are twice as likely to say whites do not benefit from extra advantages (60% vs. 30%). Similarly, there is a wide gap between the share of whites (49%) and nonwhites (20%) in suburban communities who say whites do not benefit from societal advantages.
Even so, among nonwhites there is a divide between those living in urban and rural areas. While 18% of nonwhites in urban areas say whites don’t have extra advantages, 30% of rural nonwhites say this.
When controlling for differences in partisanship across community types, the racial divide persists on this issue. Among Republicans living in suburban areas, 72% of whites say that whites don’t benefit from societal advantages, compared with 52% of nonwhites – a 20-percentage-point gap. And among suburban Democrats, whites are 8 points more likely than nonwhites (19% vs. 11%) to say this.
Similarly, there is a racial gap in views of demographic change in the U.S. Across all community types, nonwhites are far more likely than whites to say it’s a good thing for the country that nonwhites will make up a majority of the population in 25 to 30 years. This pattern can also be seen in the suburbs, where 14% of whites say this type of demographic change is good for the country, compared with 46% of Hispanics and 56% of blacks. A majority of suburban whites (64%) say this demographic change is neither good nor bad for the country.
Millennials are significantly more likely to favor same-sex marriage than Gen Xers, Boomers across all community types
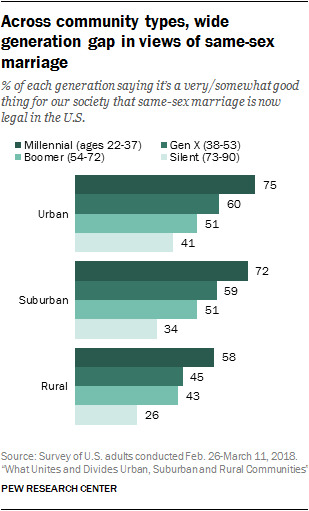 Millennials across urban, suburban and rural areas are significantly more likely than Baby Boomers and members of the Silent Generation to say they think the legalization of same-sex marriage is a good thing for society.
 This difference is stark in the suburbs. About seven-in-ten Millennials living in suburban areas (72%) say the legalization of same-sex marriage is a good thing. Among Gen Xers as well, a majority (59%) say this is a good thing for society. Boomers in suburban areas are more divided in views on same-sex marriage: About half (51%) say it is a good thing for society. Just one-third of suburban Silents say this is a good thing.
These generational differences on same-sex marriage remain, even when controlling for differences in the partisan composition of each community.
Views of immigrants also differ widely by generation. Roughly half (52%) of Millennials in rural areas say the growing number of newcomers from other countries strengthens American society compared with 36% of Baby Boomers in rural areas and 32% of Silents who say the same.
This pattern is nearly identical across community types, with Millennials in urban and suburban areas also more likely than Boomers and members of the Silent Generation to say newcomers strengthen society.
Across community types, women are more likely than men to say obstacles still exist for women

Majorities of Americans in all three community types say there are still significant obstacles that make it harder for women to get ahead than men. Americans living in urban areas are somewhat more likely to say this is the case (60%), than are those in suburban (55%) and rural (53%) areas.
However, there is a significant gap between men and women on views about the obstacles women face to get ahead. Women are far more likely than men to say significant obstacles still exist that make it harder for women to get ahead. Two-thirds of women, compared with 46% of men, say obstacles still exist.
And this gender gap is consistent across all types of communities. For example, 62% of rural women say they think obstacles still exist for women, compared with 43% of rural men.
Even after controlling for party, the gender gap persists across community types. For example, among Republicans in rural areas, women are about twice as likely as men to say obstacles still exist that keep them from getting ahead (53% of rural Republican women vs. 27% of rural Republican men).
How people in urban, suburban and rural communities see each other – and say others see them
 Most Americans in urban, rural and suburban areas say people who live in the same type of community as they do generally share their values, but they are less convinced about those in other types of communities. This is particularly the case in rural areas, where about six-in-ten say most people who live in cities have values that are different from their own, but substantial shares of urban and suburban dwellers also see differences between their values and those in other community types.
 Majorities of urban and rural residents alike say that people who don’t live in their type of community have a very or somewhat negative view of those who do (63% in urban and 56% in rural areas). About two-thirds or more in urban and rural areas (65% and 70%, respectively) also say people in other types of communities don’t understand the problems people in their communities face.
In contrast, most suburbanites (60%) say people who don’t live in the suburbs have a very or somewhat positive view of those who do. And suburbanites are about evenly divided on the extent to which others understand the types of problems suburban communities face: 45% say they do and 52% say they don’t.
At the same time, majorities in urban, rural and suburban areas say they themselves understand the problems people in other types of communities face. For example, 67% of urban dwellers say they understand the problems faced by those in the suburbs very or somewhat well, and 59% say they understand the problems faced by those in rural areas. Similarly, 64% in rural areas say they understand the problems facing those in the suburbs and 57% say they understand the problems urban dwellers face.
When it comes to how the federal government spends its money, majorities of Americans across community types say rural areas receive less than their fair share. There’s less agreement on the amount of resources that are going to cities: A 49% plurality of urban residents say their type of community receives less than their fair share from the federal government; smaller shares of suburban and rural residents share this view. Opinions are mixed when it comes to federal spending in suburban areas.
A majority of rural Americans see a values gap between themselves and urban dwellers
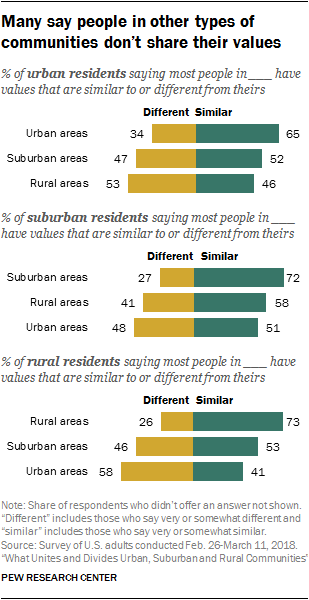 About seven-in-ten adults in rural (73%) and suburban (72%) areas, and 65% in urban areas, say most people who live in the same type of community as they do have values that are very or somewhat similar to their own. When it comes to whether they have values in common with people who live in other types of communities, however, the public is more divided.
 Among urban dwellers, 46% say most people in rural areas have values that are similar to theirs, while 53% say the values of rural Americans are very or somewhat different. This is in line with the way urban adults view those in the suburbs: 52% say people in the suburbs generally share their values, 47% say they don’t.
Like those in urban areas, rural residents are also divided on whether the values of suburbanites are generally similar to (53%) or different from (46%) theirs. But a majority of rural dwellers (58%) say urban Americans have values that are very or somewhat different from their own.
Suburbanites are somewhat more likely to say they have values in common with people in rural areas than with those who live in cities: 58% in the suburbs say most people in rural areas have values that are very or somewhat similar to theirs, compared with 51% who say the same about people in urban areas.
Majorities of urban and suburban Democrats see a values divide with rural residents; most suburban and rural Republicans say people in cities don’t share their values
 In urban and suburban communities, perceptions of a values divide with those who live in rural areas vary significantly across party lines. Most Republicans and Republican-leaning independents in these types of communities (64% in urban and 78% in suburban areas) say most people in rural areas have values that are very or somewhat similar to theirs. In contrast, majorities of Democrats and Democratic-leaning independents in urban (59%) and suburban (58%) areas say the values of people in rural areas are generally different from theirs; this is particularly the case among urban and suburban Democrats with a bachelor’s degree or more education as well as those who describe their political views as liberal.
 Partisanship is also linked to how people in suburban and rural communities see the values of those who live in cities relative to their own. In the suburbs, 65% of Democrats say most people in urban areas have values that are similar to theirs; only about a third of suburban Republicans (34%) say the same.
The partisan gap is somewhat smaller but still significant among rural dwellers. While just about a third of rural Republicans (34%) say people in urban areas have values that are very or somewhat similar to theirs, rural Democrats are about evenly divided, with 49% saying the values of people in cities are similar to and 50% saying they are different from their own values.
Even among Republicans who themselves live in urban areas, only about half (48%) say most people in cities share their values. By comparison, majorities of Republicans in suburban (75%) and rural (82%) communities say most people in their community type have values that are similar to theirs; majorities of Democrats across urban (72%), suburban (70%) and rural (63%) communities also say people in their type of community generally share their values.
This perceived values gap doesn’t extend to views of the suburbs. Across community types, Republicans and Democrats offer similar perceptions of whether the values of most people in suburbs are similar to or different from their own.
Majorities in urban and rural areas say others have a negative view of people in their type of community
 In urban and rural areas alike, more than half (63% and 56%, respectively) say people who don’t live in their type of community have a very or somewhat negative view of those who do. In contrast, 60% of those in suburban areas say most people who live outside of the suburbs have a very or somewhat positive view of suburban residents.
 For the most part, opinions on this don’t vary across demographic groups, but urban and rural residents with a bachelor’s degree or more education are more likely than their less educated counterparts to say those outside of urban and rural areas have a negative view of those who live in these types of communities. About seven-in-ten college graduates in urban (72%) and rural (69%) areas say others have a negative view of people in their community type; 59% of those with some college or less education in urban areas and 53% in rural areas say the same.
Most urban and rural Americans say people in other types of communities don’t understand the problems people in their community face
 Solid majorities in rural (70%) and urban (65%) areas say people who live outside of these areas don’t understand the types of problems faced in these types of communities; smaller shares in suburban areas (52%) say most people in other types of communities don’t understand the problems suburbanites face. Suburban residents who say they live very far from the city are more likely than those who live very close or somewhat close to the city to say most people who don’t live in the suburbs don’t understand the types of problems they face (66% vs. 49% and 50%, respectively).
 While there are no racial differences in the views of urban and suburban dwellers, whites in rural areas are far more likely than their nonwhite counterparts to say people outside of rural areas don’t understand the types of problems people in their type of community face: 74% of rural whites say this is the case vs. 57% of nonwhites in rural parts of the country.
Among rural and urban dwellers, those with more education are particularly likely to feel that others lack understanding of the types of problems people in their type of community face. For example, 82% of rural residents with a bachelor’s degree or more education – vs. 74% of those with some college experience and 63% with a high school diploma or less – say people outside of rural areas don’t understand the types of problems rural Americans face. In cities, 73% of college graduates and 67% of those with some college experience say people outside of urban areas don’t understand the types of problems people in their community face; 56% of those with a high school diploma or less education say this is the case.
Majorities say they understand the problems faced in other types of communities
While many Americans, particularly in urban and rural areas, don’t think others understand the problems people in their type of community face, majorities say they personally understand the problems faced by people in other types of communities very or somewhat well. This is the case among urban, suburban and rural residents asked about each of the other two types of communities.
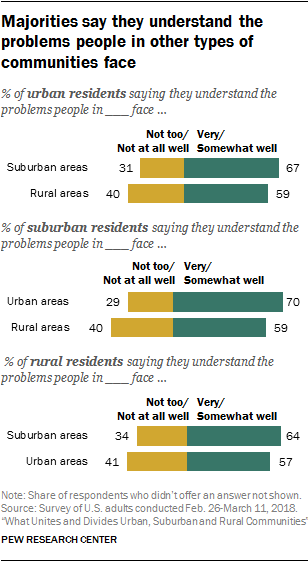 Among those in urban areas, 67% say they understand the types of problems people in the suburbs face; 59% say the same about the problems experienced by rural residents. Similarly, majorities of suburbanites say they understand the types of problems people in urban (70%) and rural (59%) areas face, and majorities of rural dwellers say they understand the types of problems people in suburban (64%) and urban (57%) communities experience.
 Perhaps not surprisingly, people in urban, rural and suburban areas who grew up in a different type of community are particularly likely to say they understand the problems faced by those who live in the type of community where they grew up. For example, 81% of urban dwellers who grew up in a rural area say they understand the problems people in rural areas face, compared with 55% of current urban residents who grew up in an urban area and 48% of those who grew up in a suburb.
In urban and suburban communities, Republicans and Republican-leaning independents are more likely than Democrats and those who lean Democratic to say they understand the problems faced by people in rural areas. At least two-thirds of Republicans in cities (72%) and suburbs (67%) – vs. 54% and 53% of Democrats, respectively – say this. There is also a partisan gap in rural communities, with a higher share of Democrats (64%) than Republicans (54%) saying they understand the types of problems people in urban areas face.
Across community types, majorities say rural areas get less than their fair share of federal dollars
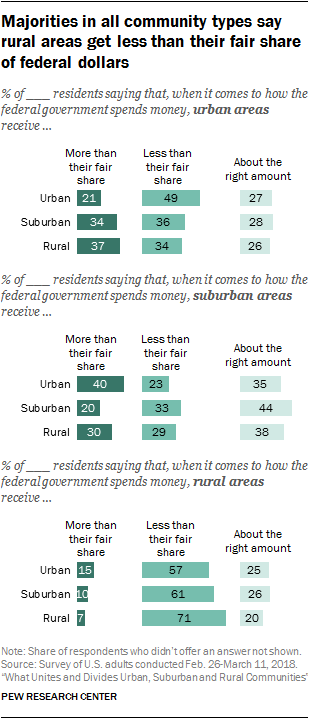 Majorities of Americans in rural (71%), suburban (61%) and urban (57%) communities say that, when it comes to how the federal government spends money, rural areas receive less than their fair share. Views are more mixed when it comes to the amount of money urban and suburban areas receive from the federal government.
 For the most part, opinions about whether urban, rural and suburban areas get more than their fair share, less than their fair share, or about the right amount of money from the federal government don’t vary significantly across demographic or party lines, but some sharp partisan differences emerge when it comes to assessments of how much money urban areas receive.
By wide margins, Republicans and Republican-leaning independents in urban, rural and suburban communities are far more likely than their Democratic and Democratic-leaning counterparts to say urban areas receive more than their fair share from the federal government (40% vs. 15% in cities, 51% vs. 22% in suburbs and 47% vs. 28% in rural areas). Meanwhile, higher shares of Democrats than Republicans say urban areas receive less than their fair share (57% vs. 25% in cities, 50% vs. 18% in suburbs and 44% vs. 24% in rural areas). Similar shares of Democrats and Republicans within each community type say urban areas receive about the right amount of federal dollars.
Views of problems facing urban, suburban and rural communities
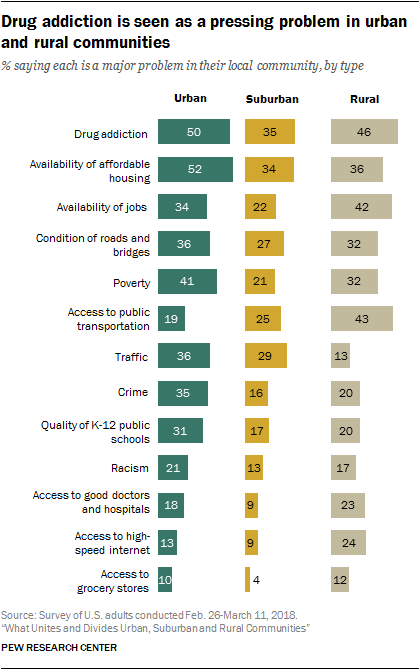 Urban, suburban and rural communities in the U.S. face a host of problems today. Some are common across community types, while others are tied to the unique nature of life in these different areas. In some cases, such as drug addiction and jobs, views about the severity of local problems are more strongly linked to race and socio-economic status than they are to the type of community one lives in, suggesting that some of the challenges Americans face today may be rooted more in demographics than in geography.
 In urban and rural communities alike, about half see drug addiction as a top-tier problem: 50% and 46%, respectively, say this is a major problem in their local community. A smaller but substantial share of adults living in suburban areas (35%) say drug addiction is a major problem where they live.
There is more concern about affordable housing, poverty, crime and the quality of public schools among urban residents than there is among their suburban and rural counterparts. For example, 52% of adults living in urban areas say the availability of affordable housing is a major problem in their local community, compared with 34% in the suburbs and 36% in rural areas. Similarly, urban residents are about twice as likely as those living in the suburbs to say crime is a major problem where they live (35% vs. 16%). One-in-five rural residents say crime is a major problem in their community.
Some problems stand out as being particularly acute in rural areas. Rural residents are significantly more likely than those living in urban or suburban areas to say the availability of jobs: 42% of rural residents say this is a major problem in their community, compared with 34% of urban and 22% of suburban residents. Rural residents are also significantly more likely to say access to public transportation is a major problem where they live.
While relatively few adults across community types say access to good doctors and hospitals, high-speed internet and grocery stores are major problems where they live, significant shares say each is at least a minor problem. Rural residents stand out in each case. When it comes to access to health care, two-thirds of rural residents say this is either a major or minor problem where they live. By comparison, roughly the same share of suburbanites (64%) say this is not a problem where they live. Similarly, while 58% of adults in rural areas say access to high-speed internet is a problem for them – including 24% who say it is a major problem – smaller shares of urban (43%) and suburban (36%) residents say this is a problem where they live. Suburban residents are significantly less likely than their urban or rural counterparts to characterize access to grocery stores as a problem in their community. Only 20% do, compared with 33% of those in urban areas and 43% in rural areas.
Concern over racism is roughly comparable in urban and rural communities – 21% of urban residents and 17% of rural residents say this is a major problem. A slightly smaller share (13%) say this is a major problem in the suburbs.
The condition of roads, bridges and other infrastructure is a major problem for 36% of urban, 27% of suburban and 32% of rural residents. Traffic, on the other hand, is a much bigger problem for those living in cities (36% say this is a major problem) or suburbs (29%) than it is for adults living in a rural area (13%).
Sharp socio-economic divide on concerns about drug addiction
Across community types, majorities of Americans say drug addiction is a problem in their community. Overall, 42% say this is a major problem and an additional 45% say it is a minor problem.
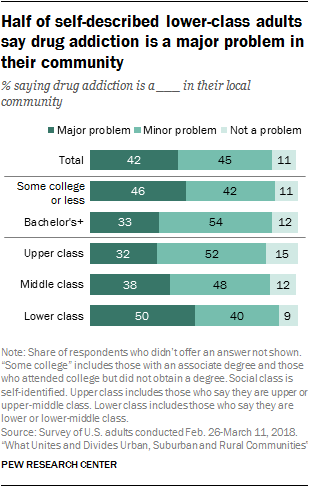 Concerns about this issue don’t vary widely between whites and nonwhites, nor do they differ markedly by age. Views on the severity of this problem do differ significantly along socio-economic lines. While a third of adults with a bachelor’s degree or more education say drug addiction is a major problem in their local community, roughly four-in-ten of those with some college education (43%) and an even higher share of those with a high school diploma or less education (48%) say the same.
 Similarly, those who describe themselves as upper class express less concern about drug addiction than do those who describe themselves as middle or lower class. In fact, fully 50% of lower-class adults say drug addiction is a major problem where they live. These gaps hold up – for the most part – across community types, although the class differences are not evident among rural residents.
Rural residents more likely to say availability of jobs is a major problem where they live
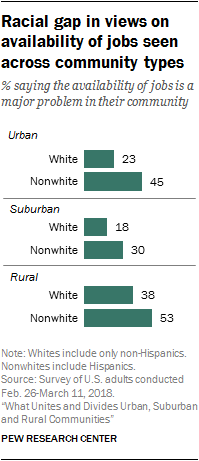 Overall, 31% of Americans say the availability of jobs is a major problem in their local community and 45% say this is a minor problem. Roughly one-in-four (23%) say this is not a problem in their community. Perceptions about local job conditions differ not only by community type but also by key demographic characteristics. There is a significant racial divide in views about the availability of jobs, with nonwhites much more likely than whites to say this is a major problem where they live (40% vs. 26%).
 This gap can be seen across community types, with significantly larger shares of nonwhites voicing concern about the availability of jobs where they live. In rural areas, where a higher share overall says jobs are a problem, 53% of nonwhites and 38% of whites characterize this as a major problem.
Views on the availability of jobs differ by educational attainment and income as well. Overall, 22% of adults with a bachelor’s degree or more education say this is a major problem in their local community, compared with 35% of those with some college or less education. Similarly, adults with annual household incomes of less than $30,000 are about twice as likely as those with incomes of $75,000 or higher to say the availability of jobs is a major problem in their community (43% vs. 20%). These patterns are consistent among urban, suburban and rural residents.
A
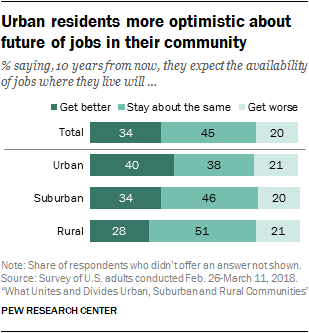 mericans have mixed views about how the job situation will be in the future. About a third (34%) say they expect the availability of jobs where they live to be better 10 years from now, 20% say it will be worse and 45% say it will stay about the same. Adults from urban areas are more optimistic than those living in suburban and rural areas. Rural residents are the least optimistic. Four-in-ten urban residents say they expect the job situation in their local community to improve over the next decade, compared with 34% of suburbanites and 28% of those living in rural areas. Roughly one-in-five across community types say they expect the job situation to get worse where they live.
 Among suburban and rural residents who say the availability of jobs is a major problem in their community, relatively few are optimistic that things will improve over the next decade – 20% of those living in rural areas and 21% of suburbanites.
Wide racial gaps on a range of community problems
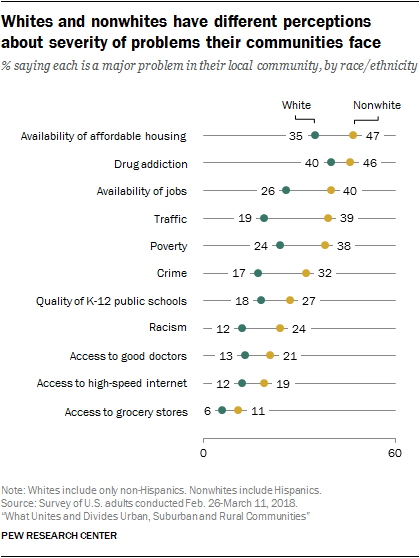 Nonwhites consistently voice greater concern than whites about the magnitude of a variety of problems in their community. In many cases, the racial gap persists across community types. In urban, suburban and rural areas, nonwhites are significantly more likely than whites to say that poverty, crime, racism, jobs, access to good doctors and hospitals, and access to high-speed internet are major problems in their local communities. In some cases, whites in the suburbs stand out as being the least concerned about these issues. For example, when it comes to poverty, 17% of suburban whites say this is a major problem in their community, compared with 28% of rural and 35% of urban whites.
 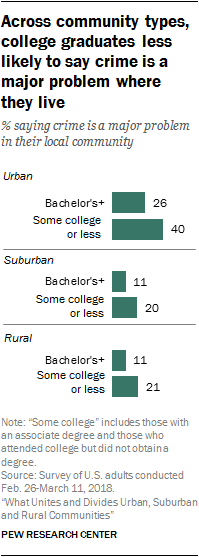 There’s a racial divide in suburban and rural communities when it comes to housing, the quality of K-12 public schools, access to grocery stores, and traffic. Whites and nonwhites in urban areas express similar levels of concern about these issues.
 There are also socio-economic divides on several of these problems. When it comes to poverty, crime and infrastructure, as well as access to quality medical care, high-speed internet, and grocery stores, adults with less than a four-year college degree are significantly more likely than college graduates to express high levels of concern. For example, 32% of adults without a bachelor’s degree say poverty is a major problem where they live, compared with 24% of those who have a four-year college degree or more. Similarly, while about one-in-five adults without a four-year college degree (17%) say access to high-speed internet is a major problem in their community, only 8% of college graduates say the same.
The educational divides in views about these local problems are less consistent than the racial divides across community types. On views about crime and access to doctors, less educated adults express higher levels of concern than those with a bachelor’s or higher degree in urban, suburban and rural areas.
Americans’ satisfaction with and attachment to their communities
 Americans are fairly satisfied with life in their local communities today, but their level of satisfaction varies widely according to how attached they feel to their community and the strength of their social connections.
 Older adults tend to feel more satisfied with their communities and more attached to them. Young adults are more restless and mobile.
About four-in-ten U.S. adults live in or near the community where they grew up. And for many of them a desire to be near family is what has kept them close to home or brought them back. Rural adults are more rooted in their local communities than are urban or suburban residents – with longer histories and less interest in moving to a new community.
Suburban and rural whites more satisfied with their communities than nonwhites
Overall, roughly eight-in-ten Americans (79%) say they are satisfied with the quality of life in their local community, with about a quarter (27%) saying they are very satisfied. While majorities across community types express satisfaction with life in their community, suburban residents (31%) are somewhat more likely than those living in urban (23%) or rural (26%) areas to say they are very satisfied. About half in each group say they are somewhat satisfied.
Community satisfaction varies across key demographic groups, with whites voicing higher levels of satisfaction than nonwhites, and older adults and college graduates among the most likely to say they are very satisfied with life in their community.
These patterns can be seen across suburban and rural areas but are less consistent in urban areas. For example, among those who live in a suburb, 35% of white residents and 24% of nonwhites say they are very satisfied with life in their community. And among rural residents, whites are about twice as likely as nonwhites to say they are very satisfied (30% vs. 16%). In urban areas, similar shares of white (25%) and nonwhite residents (21%) say they are very satisfied with the quality of life in their community.
Similarly, older adults (those ages 65 and older) in suburban and rural areas are significantly more likely than their younger counterparts to say they are very satisfied with life in their community. In rural areas, 43% of those ages 65 and older say they are very satisfied, compared with only 15% of those ages 18 to 29. Roughly a third (32%) of young adults in rural areas say they are very or mostly dissatisfied with life in their community; this is significantly higher than the share of young adults in suburban areas who say the same (21%). Satisfaction with community life is largely consistent across age groups in urban areas.
When it comes to educational attainment, college graduates express higher levels of satisfaction across community types – with roughly a third of bachelor’s degree holders (34%) saying they are very satisfied with the quality of life in their community, compared with a quarter of those without a four-year college degree.
About four-in-ten Americans say they don’t feel attached to their community
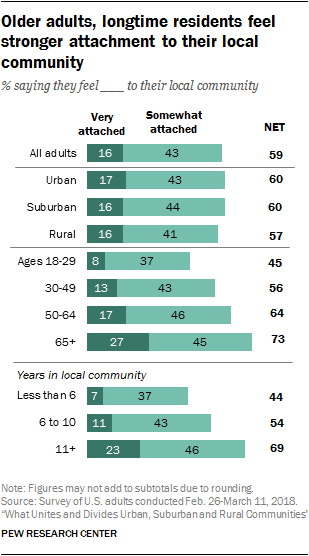 A majority of Americans (59%) feel at least somewhat attached to their local community, but relatively few (16%) say they feel very attached. Roughly four-in-ten adults (41%) say they are not too or not at all attached to their local community. These sentiments vary widely by stage of life, time spent in the community and social connections.
 Interestingly, feelings of attachment do not differ markedly across community type. Nearly identical shares of adults living in urban (60%), suburban (60%) or rural (57%) communities say they feel very or somewhat attached to their local community, with about one-in-six in each type of area saying they feel very attached.
Older adults feel a stronger attachment to their communities than their middle-aged and young adult counterparts, and this is true across community types. Among all adults ages 65 and older, 73% say they feel very or somewhat attached to their community. This compares with 64% of those ages 50 to 64, 56% of those 30 to 49 and 45% of those younger than 30.
Of course, older adults tend to have lived in their community for a longer period of time, but even after controlling for this factor, the age pattern persists. Among adults who have lived in their community for 11 years or more, older adults are significantly more likely than others to say they are very attached to their community (32% of those 65 and older, compared with roughly one-in-five middle-aged adults and 13% of young adults).
Overall, the number of years spent in a community is strongly linked with feelings of community attachment. Among those who have lived in their community for more than a decade, 69% say they feel very or somewhat attached to their community. The shares are significantly lower among those who have lived in their community six to 10 years (54%) or less than six years (44%).
Social connections are also linked to community attachment. Adults who say they know all or most of their neighbors are more than twice as likely as those who don’t know any of their neighbors to say they feel very or somewhat attached to their community (77% vs. 32%).
 Again, knowing one’s neighbors is connected with how many years an individual has lived in a community. But even among adults who have lived in their community for more than a decade, those who know most of their neighbors express higher levels of community attachment: 81% who say they know all or most of their neighbors also say they feel very or somewhat attached to their community. This compares with 64% of those who know some of their neighbors and 47% of those who don’t know any of their neighbors.
 Adults who own their home express higher levels of attachment to their local community than those who rent. Roughly two-thirds (65%) of homeowners say they feel attached to their community, including 20% who say they are very attached. By comparison, 52% of renters say they are attached to their local community, including 11% who are very attached.
Rural residents are more rooted in their communities
 Just over half of all adults (54%) say they have lived in their local community for 11 years or more, with 34% saying they’ve been in the same community for more than two decades. Some 14% have lived in the same place for six to 10 years. And roughly a third (32%) have lived in their community for less than six years (including 7% who have not yet been there a year).
 Rural residents are more likely than other adults to be longtime residents in their communities: 63% have been living in their local community for 11 years or more, compared with 53% of suburban dwellers and 45% of those living in urban areas. About four-in-ten rural residents (41%) have lived in their local community in excess of 20 years.
Rural communities tend to have a higher concentration of older adults, which might help explain why rural residents are more likely to have lived in their communities for more than a decade. But even after controlling for age, the longevity patterns are similar. Among those younger than 50, 54% of rural residents have lived in their community for 11 years or more, compared with 38% of suburban and 32% of urban residents.
 Overall, about four-in-ten Americans (42%) currently live in or near the community where they grew up, including 21% who say they have always lived there and 20% who moved away at some point but have since moved back. Some 58% of adults say they do not live in or near the community where they grew up.
 Again, these patterns differ somewhat by community type. Rural residents (47%) are more likely than those living in the suburbs (38%) to say they currently live in or near the community where they grew up; 42% of urban residents say the same. About a quarter or less in rural (26%), urban (21%) and suburban (18%) areas say they have always lived in or near the community where they live now.
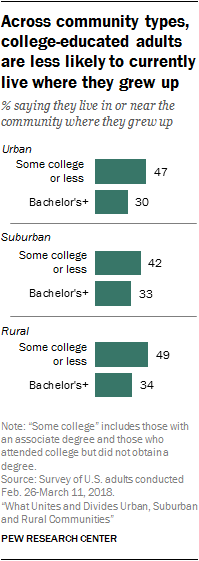
These mobility patterns differ widely by educational attainment. Roughly a third of adults with a four-year college degree (32%) say they currently live in or near the community where they grew up, compared with 46% of those without a college degree. And those who don’t have a college degree are about twice as likely as those who do to say they’ve lived in or near that community their entire life (26% vs. 12%).
These patterns are nearly identical across community types, with college graduates in urban, suburban and rural areas significantly less likely than non-college graduates to say they live in or near the community where they grew up.
Family ties draw many people back to the place they grew up
 For the 21% of Americans who say they have always lived in or near the community where they grew up, family ties stand out as one of the primary motivations for staying put. Roughly a third of adults who have stayed in their communities (35%) say a desire to be near family is one of the main reasons they have done so.
 Others (17%) point to factors having to do with the quality of life in their community – saying it’s a good place to live and raise a family, the cost of living is reasonable, or that they like the climate, amenities, schools, or the sense of community it provides.
Some 13% of adults say they’ve stayed in their community for job-related reasons, and 12% attribute their lack of mobility to simply feeling comfortable and not having any desire to leave. For some adults who have never lived outside the area where they grew up, moving to a new community is not an option; 7% say they cannot afford to move.
There is very little variation across community types in the reasons for staying put. Whether they are living in an urban, suburban or rural area, more adults who say they still live in or near the community where they grew up list proximity to family than any other factor as a top reason why they’ve never left. And there are relatively few differences across key demographic groups. Whites (40%) are more likely than nonwhites (26%) to say living near family is a main reason why they have stayed in the same community. Young adults are less likely than their older counterparts to cite the quality of life in their community as a reason for staying (7% of 18- to 29-year-olds say this compared with 21% of those ages 30 and older) and more likely to say they can’t afford to move (12% vs. 5%).
For the 20% of adults who moved away from the community where they grew up but eventually returned, the reasons for coming back are similar to the reasons some people have never left. Being near family tops the list, with 42% saying this is a main reason why they came back to live in or near the community where they grew up. Some 22% point to factors having to do with the quality of life in that community – such as the cost of living, climate or amenities.
One-in-ten say they came back for job-related reasons and 11% say a sense of familiarity or comfort drew them back.
Suburban (50%) and rural (42%) residents are significantly more likely than those living in urban areas (30%) to say they came back to the community where they grew up in order to be near family, but even for urban dwellers, family tops the list of reasons.
About three-in-ten Americans say all or most of their family members live nearby
 Perhaps not surprisingly, people who live in or near the community where they grew up are more likely than those who do not to say all or most of their extended family members live within an hour’s drive of where they live (45% vs. 17%). There is a difference, however, between those who have stayed in the community where they grew up their entire lives and those who moved away and returned to the community where they grew up: 52% of those who stayed say all or most of their family members live nearby, compared with 38% of those who moved and later returned to live in or near where they grew up. This pattern is consistent across urban, rural and suburban communities.
 Overall, a majority of Americans (55%) say at least some members of their extended family live within an hour’s drive from them, including 29% who say all or most of them do. Rural Americans are somewhat more likely than their urban and suburban counterparts to say all or most of their family members live within an hour’s drive (33% vs. 26% and 27%). In turn, about one-in-five urban (23%) and suburban (21%) dwellers say none of their extended family members live near them, compared with 15% of those in rural areas.
Adults who have moved away from their hometowns often end up in similar types of communities
 Among the majority of Americans who no longer live in or near the community where they grew up, those who grew up in the suburbs are most likely to have landed in another suburban community. Some 57% of adults who grew up in the suburbs and say they no longer live in the community where they grew up currently live in a suburb. Adults who grew up in an urban area but moved away are about equally likely to now be living in a city (40%) or a suburb (35%). Only a quarter have ended up in a rural area.
 Similarly, those who grew up in a rural area but no longer live in the community where they grew up are most likely to be living in a suburb (40%) or a rural area (38%). About one-in-five (22%) of these former rural residents now live in an urban area.
About a third of Americans say they would move to a new community if they could
 When asked if they would move to a different community if they could, 32% of adults say they would want to move. An additional 31% say they are not sure if they would want to move and 37% say they would not move.
 The desire to move differs across community types, and again there is a strong indication that rural residents are more firmly rooted in their local communities. Urban (37%) and suburban (34%) residents are significantly more likely than those living in rural areas (25%) to say they would move if they could. Some 43% of rural residents say would not want to move away from their current community.
Not surprisingly, young adults stand out in terms of their desire to move. Among those ages 18 to 29, 43% say they would want to move to a different community if they could. By comparison, 35% of those ages 30 to 49 and 29% of those 50 to 64 say the same. Only about one-in-five adults ages 65 and older (18%) say they would like to move.
These age patterns for the most part hold up across community types. In suburban and rural areas, young adults are significantly more likely than middle-aged or older adults to say they would like to move if they could. In urban areas, there is not a significant gap in the desire to move between those ages 18 to 29, 30 to 49 or 50 to 64. Across all three community types, older adults are the least inclined to say they would like to move.
Attachment to community and connections with neighbors are strongly linked to feelings about moving. People who say they are not too or not at all attached to their community are about five times as likely as those who feel very attached to say they would like to move to a new community (50% and 11%, respectively). Similarly, those who say they don’t know any of their neighbors are about twice as likely to say they would like to move as those who know all or most of their neighbors (50% vs. 23%).
 The desire to move doesn’t necessarily translate into an ability to do so. Roughly one-in-five of those who say they would like to move to a different community if they could say it is not too likely (13%) or not at all likely (5%) that they will move. About half (52%) say it is very likely they will do this at some point in the future, and an additional 29% say it is somewhat likely.
 Urban residents who say they would like to move are more likely than those living in suburban or rural areas to say this is probably going to happen (61% in urban areas say it’s very likely they will move at some point, compared with 49% in the suburbs and 47% in rural areas).
About three-in-ten adults who say they are not interested in moving to a new community say there’s a chance they may do so anyway. Some 8% say it’s very likely they will move at some point in the future and 23% say it’s somewhat likely.
People who do express an interest in moving don’t necessarily want to move to a different type of community. Roughly four-in-ten suburban residents who would like to move (41%) say they would move to another suburban area. Some 35% say they would move to a rural area, and 23% would like to move to a city.
The pattern is similar for rural residents who say they would like to move if they could. Four-in-ten say they would move to another rural community. Roughly the same share (39%) say they would move to a suburban community, while fewer (20%) say they would move to a city.
Urban residents who would like to move are somewhat less inclined to say they would go to another urban area – only 28% say so. Some 41% of city dwellers say, if they could, they would move to a suburb and 30% say they would move to a rural area.
Majorities in urban, rural and suburban areas say it’s very important for them to live in a community that is a good place to raise children
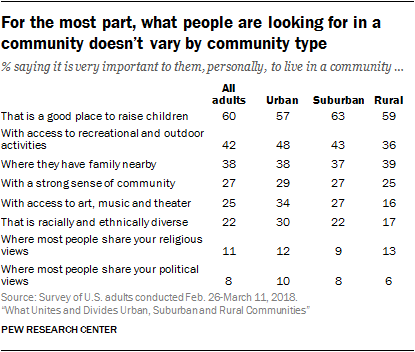 In deciding where to live or assessing the quality of life in their current community, Americans have a variety of factors to consider – from outside activities to culture to racial and ethnic diversity.
 For a majority of Americans – across community types – living in an area that is a good place to raise children is a high priority. About six-in-ten Americans in urban (57%), suburban (63%) and rural (59%) areas say it is very important to them, personally, to live in a community that is a good place to raise children.
Smaller shares say the same about living in a place with access to recreational and outdoor activities (42% overall), where they have family nearby (38%) and where there is a strong sense of community (27%). Roughly one-in-five (22%) say it is very important to them to live in a place that is racially and ethnically diverse. Fewer place a high level of importance on living in a community where most people share their religious (11%) or political (8%) views.
For the most part, views about what is important in a community vary modestly, if at all, across demographic groups, but there are some exceptions. For example, across community types, women are far more likely than men to say it’s very important to them personally to live in a community where they have family nearby: 45% of women in urban and suburban areas and 48% in rural areas say this is very important, compared with about three-in-ten men in each type of community.
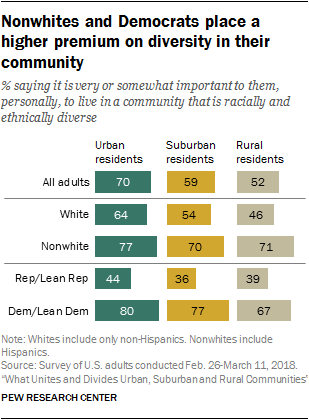
In urban, suburban and rural areas, those with a bachelor’s degree or more education are more likely than those without a college degree to say it’s important to them to live in a community with access to art, music and theater. This is particularly important to urban college graduates: 47% in this group say this is very important to them, compared with 28% of non-college graduates in urban areas, 36% of college graduates and 21% of non-college graduates in the suburbs, and 23% of college graduates and 14% of non-college graduates in rural areas.
In urban areas, nonwhites place a higher premium than whites on living in a community that is a good place to raise children: 64% of urban nonwhites say this is very important to them, personally, compared with 49% of their white counterparts. There are no significant differences between whites and nonwhites on this item in suburban or rural areas, however.
Urban residents are more likely to see racial and ethnic diversity as important
While relatively few Americans overall (22%) say it is very important to them personally to live in a community that is racially and ethnically diverse, a majority (59%) see this as at least somewhat important. This is particularly the case in urban areas, where 70% say it is very or somewhat important to them, personally, to live in a community that is racially and ethnically diverse, compared with 59% of those in suburbs and 52% of those in rural areas.
Across community types, nonwhites are more likely than whites to say living in a place that is racially and ethnically diverse is important to them. For example, while about seven-in-ten nonwhites in rural communities (71%) consider this at least somewhat important, only 46% of rural whites feel the same way.
There are also large partisan gaps when it comes to this item. Overall, three-quarters of Democrats and Democratic-leaning independents (including 80% in urban, 77% in suburban and 67% in rural areas) say it’s important to them, personally, to live in a place that is racially and ethnically diverse; about four-in-ten of all Republicans and Republican-leaning independents say the same (44% in urban, 36% in suburban and 39% in rural communities).
How urban, suburban and rural residents interact with their neighbors
Most Americans say they know at least some of their neighbors, but only about three-in-ten say they know all or most of them. Rural residents are more likely than those in urban or suburban areas to say they know all or most of their neighbors, but they don’t necessarily interact with their neighbors more than their counterparts in other community types.Overall, Americans tend to be trusting of their neighbors, but this is particularly the case in suburban and rural areas. About six-in-ten in these types of community say they have a neighbor they would trust with a key to their home, compared with about half in urban areas.
When asked to describe their neighbors, people in rural areas are far more likely than those in cities and suburbs to say all or most of their neighbors share their race or ethnicity. Suburbanites are somewhat more likely than their urban and rural counterparts to say their neighbors are the same social class as they are, while relatively few across community types say all or most of their neighbors share their political views.
Rural residents are the most likely to know their neighbors
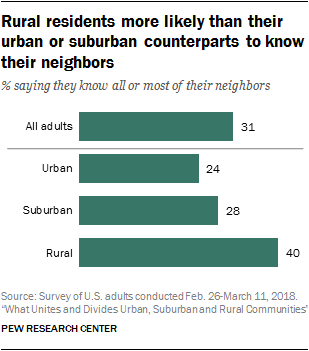 Four-in-ten
rural residents say they know all or most of their neighbors; the
shares are smaller among those living in urban (24%) and suburban (28%)
areas.
Four-in-ten
rural residents say they know all or most of their neighbors; the
shares are smaller among those living in urban (24%) and suburban (28%)
areas.Across community types, Americans ages 65 and older are substantially more likely than their younger counterparts to say they know all or most of their neighbors. The oldest urban residents are 24 percentage points more likely than those ages 18 to 29 to say they know all or most of their neighbors (39% vs. 15%); that gap is 18 points among suburban residents (36% vs. 18%) and 14 points among rural residents (48% vs. 34%). Young adults ages 18 to 29 in rural areas are about twice as likely to say they know all or most of their neighbors as young adults in urban and suburban areas.
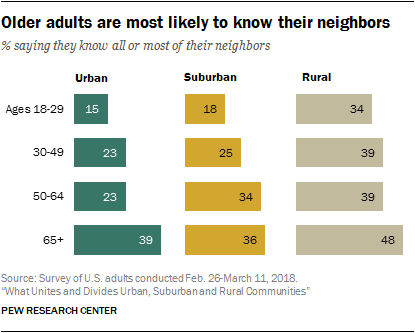 There
are some differences by social class in the suburbs: 36% of
suburbanites who say they are upper class and 31% of those who identify
as middle class say they know all or most of their neighbors, compared
with 20% of those who say they are lower class. There are no
statistically significant differences across social classes in urban or
rural areas.
There
are some differences by social class in the suburbs: 36% of
suburbanites who say they are upper class and 31% of those who identify
as middle class say they know all or most of their neighbors, compared
with 20% of those who say they are lower class. There are no
statistically significant differences across social classes in urban or
rural areas.Interactions with neighbors don’t vary much by community type
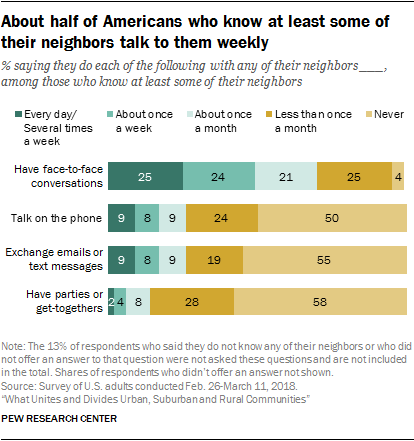 Among
Americans who know at least some of their neighbors, one-in-four say
they have face-to-face conversations with them at least several times a
week. An additional 24% say they have these conversations about once a
week, 21% say about once a month and 25% say less often than that. An
additional 4% of those who know at least some of their neighbors say
they never talk to them face-to-face.
Among
Americans who know at least some of their neighbors, one-in-four say
they have face-to-face conversations with them at least several times a
week. An additional 24% say they have these conversations about once a
week, 21% say about once a month and 25% say less often than that. An
additional 4% of those who know at least some of their neighbors say
they never talk to them face-to-face.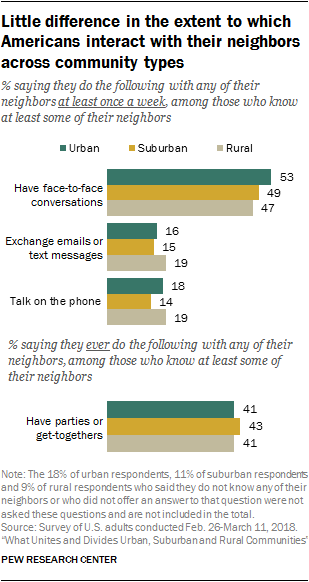 Other
forms of interacting with neighbors occur less often. Some 17% of those
who know their neighbors say they exchange emails or text messages with
them at least weekly, while 9% say they do this monthly, 19% say less
often and 55% never do this. Similarly, 16% of those who know their
neighbors talk on the phone with them on a weekly basis, 9% say they do
this once a month, 24% do it less often and 50% say they never do.
Other
forms of interacting with neighbors occur less often. Some 17% of those
who know their neighbors say they exchange emails or text messages with
them at least weekly, while 9% say they do this monthly, 19% say less
often and 55% never do this. Similarly, 16% of those who know their
neighbors talk on the phone with them on a weekly basis, 9% say they do
this once a month, 24% do it less often and 50% say they never do.A majority of Americans who know their neighbors (58%) say they never have parties or get-togethers with them, though 28% say they do so less than once a month and 14% say they have get-togethers with their neighbors at least monthly.
How often people interact with their neighbors does not vary much across different types of communities. Urban residents who know at least some of their neighbors are somewhat more likely than those in rural areas to say they talk to their neighbors face-to-face on a weekly basis, but about half in each community type say this is the case (53% in cities, 49% in suburbs and 47% in rural areas). Across community types, similar shares of adults who know at least some of their neighbors say they regularly exchange emails or text messages, talk on the phone or have parties or get-togethers with their neighbors.
Majority of Americans say they have a neighbor they would trust with a set of keys to their home
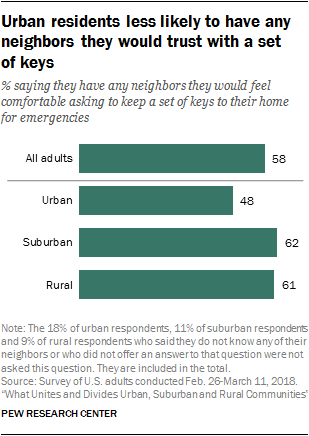 More
than half of all U.S. adults (58%) say they have a neighbor they would
feel comfortable asking to keep a set of keys to their home for
emergencies (if they were locked out, for example).
More
than half of all U.S. adults (58%) say they have a neighbor they would
feel comfortable asking to keep a set of keys to their home for
emergencies (if they were locked out, for example).Suburban (62%) and rural (61%) residents are more likely than their urban counterparts (48%) to say they would be comfortable with a neighbor having a set of keys to their home.
The longer people have lived in their community, the more likely they are to have a neighbor they would trust with a key to their home. But even among those who report that they have lived in their community for less than one year, 34% say they would be comfortable with a neighbor having their keys. Meanwhile, 64% of those who have lived in their community for six or more years and 47% of those who have done so for one to five years say the same. Those who own their home are more likely than renters to say they would be comfortable with a neighbor having a set of keys to their home (67% vs. 45%).
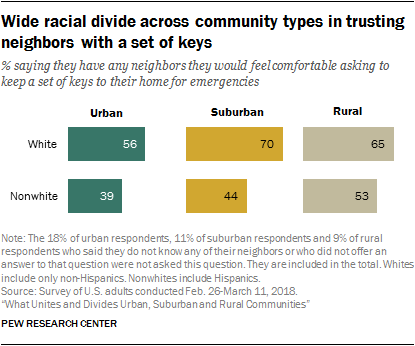 Across
community types, white adults are more likely than nonwhites to say
they would trust a neighbor to keep a set of keys to their home. In the
suburbs, 70% of whites say they would feel comfortable with a neighbor
having their keys, compared with 44% of nonwhites. In urban areas, 56%
of whites say this compared with 39% of nonwhites; in rural areas, the
shares are 65% and 53%, respectively.
Across
community types, white adults are more likely than nonwhites to say
they would trust a neighbor to keep a set of keys to their home. In the
suburbs, 70% of whites say they would feel comfortable with a neighbor
having their keys, compared with 44% of nonwhites. In urban areas, 56%
of whites say this compared with 39% of nonwhites; in rural areas, the
shares are 65% and 53%, respectively.Older people, those with more education and those who identify as upper class are the most likely to trust their neighbors with a set of keys. Still, race remains a significant factor even when controlling for these other demographics.
Rural residents are the most likely to say their neighbors share their race or ethnicity
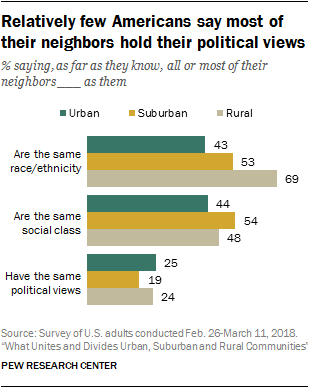 A
slight majority of Americans (55%) say all or most of their neighbors
are the same race or ethnicity as they are. Similarly, about half (49%)
say their neighbors are mostly the same social class as them. A much
smaller share (22%) say most of their neighbors share their political
views – in fact, far more (45%) say only some or none of their neighbors
have the same political views as them, while 28% say about half do.
Perceptions of neighborhood racial, socioeconomic and political
composition vary by community type.
A
slight majority of Americans (55%) say all or most of their neighbors
are the same race or ethnicity as they are. Similarly, about half (49%)
say their neighbors are mostly the same social class as them. A much
smaller share (22%) say most of their neighbors share their political
views – in fact, far more (45%) say only some or none of their neighbors
have the same political views as them, while 28% say about half do.
Perceptions of neighborhood racial, socioeconomic and political
composition vary by community type.Overall, whites are the most likely to say their neighbors share their race or ethnicity
About seven-in-ten people who live in rural areas (69%) say all or most of their neighbors are their same race or ethnicity, while much smaller shares of those in suburban (53%) and urban areas (43%) say the same.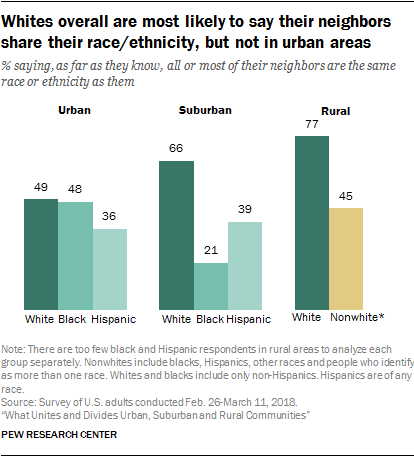 Overall,
whites are much more likely than blacks and Hispanics to say their
neighbors are mostly of the same race or ethnicity as they are. This
pattern holds in suburban areas – where 66% of whites say all or most of
their neighbors are of their race or ethnicity, compared with 21% of
blacks and 39% of Hispanics – and in rural areas, where 77% of whites
say their neighbors mostly share their race or ethnicity, compared with
45% of nonwhites.5 In
urban areas, however, a different pattern emerges. Whites (49%) and
blacks (48%) are equally likely to say most of their neighbors share
their race or ethnicity, while 36% of Hispanics say the same.
Overall,
whites are much more likely than blacks and Hispanics to say their
neighbors are mostly of the same race or ethnicity as they are. This
pattern holds in suburban areas – where 66% of whites say all or most of
their neighbors are of their race or ethnicity, compared with 21% of
blacks and 39% of Hispanics – and in rural areas, where 77% of whites
say their neighbors mostly share their race or ethnicity, compared with
45% of nonwhites.5 In
urban areas, however, a different pattern emerges. Whites (49%) and
blacks (48%) are equally likely to say most of their neighbors share
their race or ethnicity, while 36% of Hispanics say the same.Those with a bachelor’s degree or more education (60%) are more likely than those who did not complete a four-year degree (53%) to say all or most of their neighbors are of their race or ethnicity. While 81% of rural college graduates say all or most of their neighbors share their race or ethnicity, 66% of those with some college or less education say the same. In suburban areas, 58% of college graduates say their neighbors mostly share their race or ethnicity, compared with 50% of those who did not complete college. And half of urban college graduates say this, compared with 40% of those with some college or less education. These gaps persist even when looking only at white Americans.
In suburban and rural areas in particular, older people are more likely than their younger counterparts to say their neighbors mostly share their race or ethnicity. For example, eight-in-ten rural residents ages 65 and older say this, compared with 70% of those ages 50 to 64, 65% of those 30 to 49 and 60% of those 18 to 29. Again, this is true for rural adults even when accounting for the fact that younger residents are less likely to be white.
College graduates across community types are more likely to say their neighbors share their social class
When it comes to perceptions of whether their neighbors share their social class, the differences by community type are not quite as pronounced. Suburban residents (54%) are more likely than those in urban (44%) and rural (48%) areas to say, as far as they know, all or most of their neighbors are their same social class.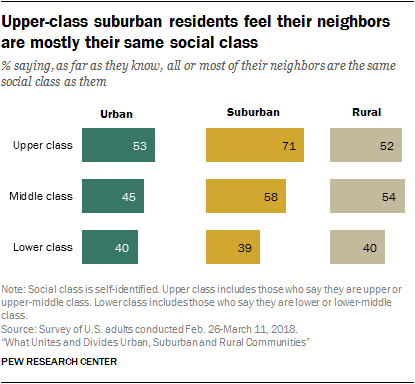 Suburban
residents who identify as upper class stand out. Some 71% say most of
their neighbors are their same social class. This is substantially
higher than upper-class residents in other types of communities (53% of
those in urban areas and 52% in rural areas) and suburban residents who
say they are middle (58%) or lower (39%) class.
Suburban
residents who identify as upper class stand out. Some 71% say most of
their neighbors are their same social class. This is substantially
higher than upper-class residents in other types of communities (53% of
those in urban areas and 52% in rural areas) and suburban residents who
say they are middle (58%) or lower (39%) class.College graduates are the most likely to say their neighbors are like them in terms of social class, and this is true across community types. In urban areas, 55% of those with at least a bachelor’s degree say all or most of their neighbors are the same social class that they are, compared with 38% of those with some college or less education. Among suburban residents, 62% of college graduates and 50% of those with some college or less education say the same. In rural areas, the shares are 55% and 47%, respectively.
Relatively few Americans say most of their neighbors share their political views
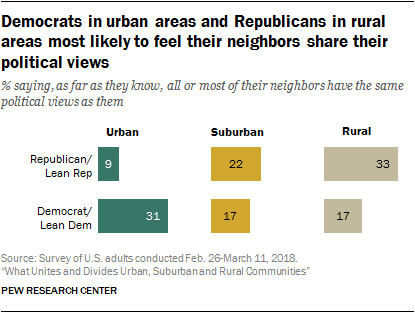 Americans
generally don’t think most of their neighbors have the same political
views they do – about one-in-five (22%) say all or most do, while 33%
say that only some and 12% say that none of their neighbors share their
political views. Meanwhile, 28% say about half of their neighbors have
their same political views.
Americans
generally don’t think most of their neighbors have the same political
views they do – about one-in-five (22%) say all or most do, while 33%
say that only some and 12% say that none of their neighbors share their
political views. Meanwhile, 28% say about half of their neighbors have
their same political views.The share saying all or most of their neighbors share their political views is somewhat higher among those in rural (24%) and urban (25%) areas – particularly those who say they live in a large city (32%) – than among suburban residents (19%).
In urban areas, Democrats and Democratic-leaning independents are about three times as likely as their Republican or Republican-leaning counterparts (31% vs. 9%) to say all or most of their neighbors share their political views. In fact, among urban Republicans, 59% say only some or none of their neighbors share their political beliefs, while 40% of urban Democrats say the same; 29% and 25%, respectively, say about half of their neighbors share their political views.
In suburban areas, 22% of Republicans and 17% of Democrats say all or most of their neighbors share their political views, but there is a wide gap in the share of Democrats and Republicans who say only some or none of their neighbors do (50% vs. 39%).
Among rural residents, 33% of Republicans say their neighbors mostly share their political views, compared with 17% of Democrats. In turn, 57% of Democrats in rural areas say only some or none of their neighbors have the same political views that they do, while 34% of rural Republicans say the same.
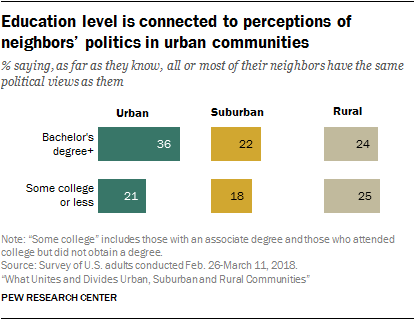 In
urban communities, education is linked to perceptions of neighbors’
political views. Some 36% of city dwellers with a bachelor’s degree or
more education say all or most of their neighbors share their political
views, compared with 21% of those without a bachelor’s degree. This
pattern is not evident among rural and suburban dwellers.
In
urban communities, education is linked to perceptions of neighbors’
political views. Some 36% of city dwellers with a bachelor’s degree or
more education say all or most of their neighbors share their political
views, compared with 21% of those without a bachelor’s degree. This
pattern is not evident among rural and suburban dwellers.Neighbors tend to interact more if they’re of the same race, social class or political party
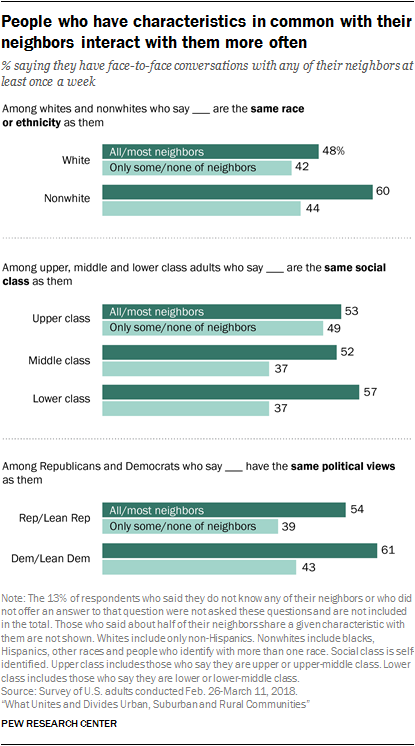 People
who report that they share characteristics with their neighbors are
also more likely to say they interact with their neighbors regularly, at
least among some subgroups.
People
who report that they share characteristics with their neighbors are
also more likely to say they interact with their neighbors regularly, at
least among some subgroups.Overall, among those who know at least some of their neighbors, 51% who say all or most of their neighbors are their same race or ethnicity say they have face-to-face conversations with their neighbors at least once a week, compared with 43% of those who say only some or none of their neighbors share their race or ethnicity.
This is highly dependent on race. Among whites, those who say all or most of their neighbors are white (48%) are roughly equally likely as those who say only some or none of their neighbors are white (42%) to say they talk face-to-face with their neighbors at least weekly. Among nonwhites, though, 60% of those who say all or most of their neighbors share their race or ethnicity say they talk with them weekly, compared with 44% of those who say only some or none of their neighbors share their race or ethnicity.
When looking at Americans who are or are not in the same social class as their neighbors, a similar pattern appears. Overall, 54% of people who say all or most of their neighbors are the same social class as they are say they have face-to-face conversations with their neighbors once a week or more often, compared with 39% of those who say only some or none of their neighbors are their same social class.
However, this difference is only seen among those who consider themselves middle or lower class. For example, 52% of middle-class Americans who say most of their neighbors are also middle class say they have weekly face-to-face conversations with their neighbors; 37% of those who say only some or none of their neighbors are middle class say the same.
When it comes to political party, Republicans and Democrats alike are more likely to say they interact with their neighbors regularly if most of their neighbors share their political views than if only some or none of them do. Overall, 58% of those who say all or most of their neighbors have the same political views they do say they talk to their neighbors face-to-face weekly, compared with 42% of those who say only some or none of their neighbors share their views. The gaps are similar among Republicans (54% vs. 39%) and Democrats (61% vs. 43%).
Life satisfaction and social support in different communities
Satisfaction with key aspects of life doesn’t seem to be strongly linked to the type of community someone lives in. Americans in urban, suburban and rural areas are about equally satisfied with their family life, social life, job and financial situation. There is also little variation among those living in different types of places in the share reporting they have social support, feel optimistic about their lives overall or feel lonely. And the idea that life in the city feels more hectic than life in the country is not borne out by the data. Urban Americans are no more likely than those living in rural and suburban areas to say they are too busy to enjoy their lives. Meanwhile, among those who say they do not have enough income to lead the kind of life they want, rural Americans tend to be the least certain that they will ever have enough to do so.
Across community types, married adults are more satisfied with their lives
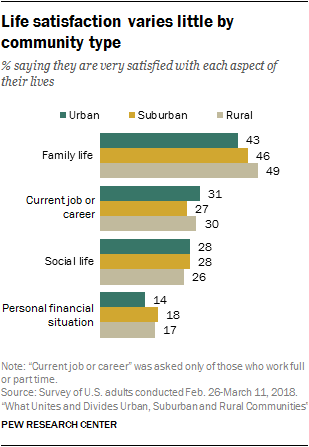 Rural residents are slightly more likely than those in urban areas to say they are very satisfied with their family life (49% vs. 43%). Some 46% of suburban residents say the same. (This difference is driven at least in part by the fact that people in rural areas are much more likely than those in urban areas to be married.)
 When it comes to their social lives, those in urban (28%), suburban (28%) and rural (26%) areas are all about equally likely to report that they are very satisfied.
Likewise, among those who are employed full or part time, similar shares say they are very satisfied with their current job or career (31% of urban, 27% of suburban and 30% of rural residents). And relatively small shares of adults in each group (whether employed or not) say they are very satisfied with their personal financial situation (14%, 18% and 17%, respectively).
While these measures of satisfaction don’t vary much by community type, some do vary by age in suburban and rural areas. Adults ages 50 and older are more satisfied than their younger counterparts when it comes to their job, social life and financial situation, and this is true across community types.
There are substantial gaps by marital status as well – married adults are much more satisfied with each aspect of their lives compared with unmarried adults. For example, 57% of married adults are very satisfied with their family life, compared with 36% of those who are unmarried. And while 32% of married adults are very satisfied with their social life, only 23% of unmarried adults are equally satisfied. This pattern holds up, for the most part, across community types.
Rural Americans tend to be the least optimistic about their financial future
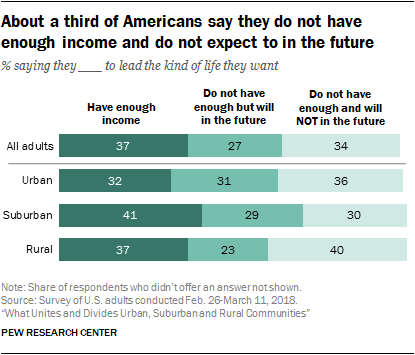 Some 37% of all U.S. adults say they currently have enough income to lead the kind of life they want, while 27% say they do not currently have enough but expect to in the future. An additional 34% say they don’t currently have enough income and don’t think they will in the future.
 These shares vary somewhat among residents of different types of communities. People living in suburbs are more likely than those in urban areas to say they currently have enough income (41% vs. 32%), while 37% of rural residents say the same. Among those who say they do not currently have enough income for the kind of life they want to lead, rural residents are the most pessimistic: Most say they don’t think they will have enough income in the future (63%), while about half of urban (53%) and suburban (51%) residents not currently making enough say the same.
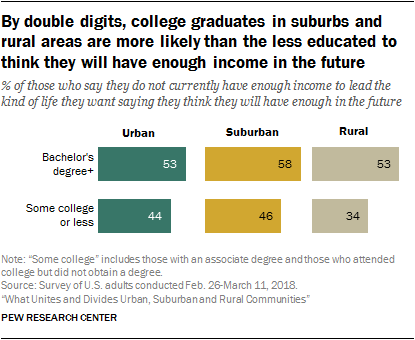 Whether one currently has enough income coming in is closely linked to socioeconomic status: Those with higher levels of education and those identifying with the upper class are among the most likely to say they currently have enough income to lead the kind of life they want, regardless of the type of community they live in. In addition, older Americans, whites and people who are married are more satisfied with the amount of income they currently have. Among rural residents only, men are more likely than women to say they have enough income (41% vs. 34%), a gap that doesn’t exist among urban (34% vs. 31%) and suburban (43% vs. 39%) residents.
 But when it comes to whether those who don’t currently have enough income think they will in the future, different patterns emerge. For example, in rural areas nonwhites who don’t have enough income now are much more likely than whites to say that they will in the future (50% vs. 31%). This is consistent in suburban (61% vs. 41%) and urban areas (52% vs. 39%) as well. Younger adults who say they currently don’t have enough are also far more likely than older adults to say they will have enough income in the future, across community types.
In rural and suburban areas, those with a bachelor’s degree or more education who don’t have enough income now are more likely than their less educated counterparts to think they will have enough in the future. About half (53%) of college graduates in rural areas who don’t currently have enough income to live the kind of life they want say they will have enough in the future, compared with 34% of their counterparts with some college education or less; the shares are 58% and 46%, respectively, among those who live in suburbs. The gap is not statistically significant among urban residents.
Similar shares across community types say they feel optimistic, busy
 When it comes to some of the more personal aspects of life – feeling supported by others or feeling lonely and isolated – Americans’ experiences do not seem to differ widely by what type of community they live in. Suburban residents are somewhat more likely than their urban counterparts to feel they have people to turn to for support all or most of the time (58% vs. 50%), while 54% of rural residents say the same.
 Relatively few adults (about one-in-ten) across community types say they feel lonely or isolated all or most of the time. Rural (50%) and suburban residents (49%) are somewhat more likely than those in urban areas (42%) to say they hardly ever or never feel lonely or isolated from those around them.
Only 12% of Americans say they feel too busy to enjoy life all or most of the time. This sentiment is no more common in urban areas than it is in suburban or rural communities.
Similarly, there are no notable differences across community types in feelings of general optimism about life. Roughly equal shares of adults in urban (42%), suburban (45%) and rural (42%) communities say they feel optimistic about their lives all or most of the time.
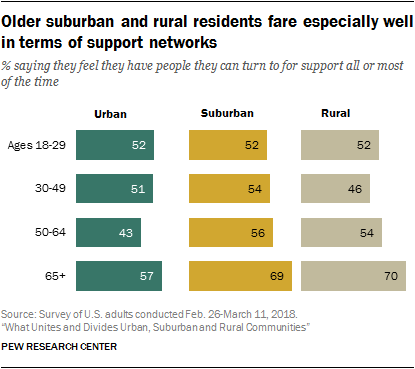 Older adults tend to fare better on these measures overall. For example, 70% of adults ages 65 and older living in rural areas say they usually have people to turn to for support, compared with 54% of those ages 50 to 64 and about half of those younger than 50. The pattern is similar among suburban residents. But in urban areas, while those ages 65 and older are more likely than adults ages 50 to 64 to say they usually have people for support (57% vs. 43%), they are not significantly more likely than younger adults to say this (51% of those ages 30 to 49 and 52% of those 18 to 29).
 Similarly, older people are more likely than their younger counterparts to say they feel optimistic about their lives in suburban and rural areas but not in urban areas. And adults ages 65 and older are the least likely to say they are too busy to enjoy life, regardless of the type of community they live in.
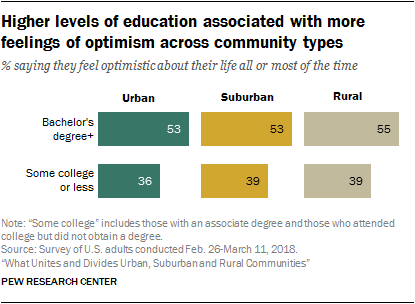 On most items, these feelings appear to be connected to education and other indicators of socio-economic status. Those who have graduated with a four-year college degree are more likely than those who have some college experience or less to say they have people to turn to for support and are optimistic about their life all or most of the time, regardless of the type of community they live in. They are also less likely to say they feel lonely or isolated from those around them. For example, roughly half of college graduates in urban (53%), suburban (53%) and rural (55%) areas say they usually feel optimistic about their life. But about four-in-ten of those with some college experience or less education say this across communities (36% of people living in urban areas, 39% in suburbs and 39% in rural areas). However, college graduates and nongraduates alike are just as likely to say they are usually too busy to enjoy life in all types of communities.
 Married Americans are significantly more likely than their unmarried counterparts to say they usually have people to turn to and are optimistic about their life. For example, 57% of married urban residents say they have people to turn to for support all or most of the time, compared with 47% of unmarried urban residents. The shares are similar in suburban (62% vs. 53%) and rural (59% vs. 51%) areas. Across community types, there are no significant differences by marital status on whether someone feels they are usually too busy to enjoy life. However, parents of children younger than 18 are more likely than those who do not have children under 18 to say this. About two-in-ten parents say they are too busy, whether they live in urban (19%), suburban (18%) or rural (17%) areas; this compares with about one-in-ten of those who are not parents in urban (10%), suburban (11%) and rural (10%) areas.