Mostrando entradas con la etiqueta youthvote. Mostrar todas las entradas

#BigData: #microsegmentación en tiempo real en el #votojoven


Rubén Weinsteiner


En 2009 estalló una nueva gripe que combinaba las cepas de la gripe aviar y la gripe porcina. La Ciencia la llamó H1N1 y se expandió rápidamente.

Los ministerios de salud de todos los países del mundo, preveían una epidemia complicada, que se iba a propagar velozmente.

Algunos la comparaban la gripe de 1918, la gripe españolaque afectó a 500 millones de personas y que causó decenas de millones de muertes.


La paranoia cundía en todos lados, la gente no iba al cine, muchos comenzaron a usar barbijos, los padres estaban aterrorizados por sus hijos. No había ninguna vacuna disponible.


La estrategia de los ministerios de salud de los diferentes países era lentificar la propagación. A eso aspiraban de máxima. Pero para ralentizarla necesitaban saber donde estaban los focos.


En EE.UU. los Centros de Control y Prevención de enfermedades, pedían que los médicos alertaran ante cada caso nuevo de la nueva gripe.

Entre que la persona se sentía mal, pasaban unos días, recién ahí iba a una guardia médica, y el mecanismo burocrático de detectar los síntomas, confirmar la gripe, preparar los informes y procesar la información, (la CDC clasificaba una vez por semana) hacía que entre la aparición de cada caso y la confirmación pasaran 2 semanas.

Con una epidemia así dos semanas es muchísimo.


Los gobiernos estaban desbordados, se desató una histeria mundial.


La solución apareció desde Google. Desde la compañía le explicaron al gobierno de EE.UU. que Google podía identificar rápido y en tiempo real, los focos de la gripe, no sólo en EE.UU. sino en todo el mundo.

Google recibe casi 4000 millones de búsquedas diarias, las archiva todas, y puede identificar desde donde viene cada búsqueda y clasificarlas por tema.


Google puso como parámetros los síntomas de la enfermedad y podía establecer desde donde y cuantas personas buscaban en Google, cosas que estuvieran relacionadas con los síntomas de la gripe H1N1.


Google tomó como parámetro las búsquedas durante otras epidemias gripales parecidas. Había muchas búsquedas que eran hipocondría pura. Pero al cruzar búsquedas dentro de los grandes números de la Big Data, empezaron a identificar los focos de propagación. Para eso utilizaron 450 millones de modelos matemáticos para identificar los focos más consistentes, y de esa manera identificaron 45 palabras de búsqueda que tenía una correlación directa con los focos que iba confirmando la CDC.

Google no sólo que detectaba los focos, sino que lo hacía en tiempo real.


Big data es dedo en el pulso en tiempo real, es tener todos los datos, no una muestra, es poder operar con todos esos datos, y es poder plantar, pescar y buscar respuestas.


La Big Data representa un cambio disruptivo en lo que hace a cuantificar y comprender comportamientos. Una inmensa cantidad de cosas que hasta acá no podían medirse, almacenarse, analizarse, compartirse y utilizarse.


Hasta acá nos manejábamos con el muestreo, ahora tenemos todos los datos y los podemos manejar.

Con la Big Data podemos predecir con precisión a través de la correlación de una enorme cantidad de datos.

Las redes sociales nos dicen que hacen, que les gusta, adonde van, a quien quieren y a quien no, millones de jóvenes. No hace falta encuestarlos, la Big Data está ahí. Es oro para los que estudiamos los sistemas de preferencias de los jóvenes.


Todo esto en tiempo real, midiendo humores, tendencias, demandas, insatisfacciones, rechazos, con el dedo el pulso segundo a segundo.

Que decir, donde, como, cuando, a través de que medios.

Con la Big Data obtenida en la Web social se puede microsegmentar y afinar el discurso, microsegmentar las piezas publicitarias, explorar deseos, miedos, demandas, ya no desde la extrapolación de una muestra, sino de la totalidad de los datos.

Rubén Weinsteiner

Identificación y pertenencia a la clase media en América latina

Identificación con la clase media y factores asociados

Tradicionalmente, la clase media ha sido conceptualizada y medida sobre la base de atributos definidos externamente por expertos, sin recurrir a las percepciones de las personas


 Esta práctica se ha justificado mediante dos argumentos:
i) las posiciones de los sujetos en la estructura socioeconómica son independientes de sus percepciones, y ii) las mediciones basadas en información subjetiva sobreestiman el peso de la clase media.
Sin embargo, una aproximación puramente externa a la medición de las clases sociales convierte en una caja negra los procesos cognitivos (identidades y expectativas) que median entre las posiciones de los sujetos en la
estructura socioeconómica y sus efectos conductuales (expresiones de malestar social)

Por consiguiente, la idea no sería una medición de clase basada en aspectos subjetivos (aun cuando una medición que integre esta dimensión es perfectamente factible), sino que se busca indagar en el vínculo entre estructura y percepciones


La pregunta fue la siguiente: “La gente algunas veces se describe a sí misma como perteneciente a una clase social. ¿Ud. se describiría como perteneciente a la
clase alta, media alta, media, media baja o baja?”.

La relación entre la reducción de la pobreza absoluta y el aumento de la clase media no necesariamente se verificará en mediciones
de clases sociales basadas estrictamente en criterios relativos.

No se pretende analizar la relación entre polarización y conflicto, dado que es una tarea que se ve obstaculizada por la falta de datos sobre el conflicto en la región. En todo caso, se han realizado esfuerzos en esa línea
Habría resultado útil examinar la evolución de las percepciones de pertenencia a la clase media para determinar si han variado a la vez que los indicadores de polarización y pobreza.
En la tradición económica han dominado aproximaciones basadas en la métrica monetaria para medir la clase media (enfoques absolutos, relativos y de polarización). A su vez, hay una tradición sociológica que ha priorizado aspectos no monetarios, como
la estructura ocupacional. Aquí no se considera que estas dos tradiciones ofrezcan los únicos métodos objetivos, puesto que las percepciones también pueden medirse según un enfoque objetivo (pese a todas las limitaciones a que está sujeto).

La antigua distinción realizada por Marx de clase en sí y clase para sí apunta a considerar el rol mediador de los aspectos cognitivos entre la estructura de clase y sus consecuencias conductuales.

Un primer paso consiste en establecer la incidencia de los sentimientos de identificación con la clase media en los países de la región. En 2011, un 38% de la población latinoamericana declaró sentirse de clase media, un 31% se consideraba de clase media baja y un 26% afirmaba pertenecer a la clase baja.

A su vez,  se aprecia que los porcentajes de población que se sienten de clase media o media baja difieren según los países. Los mayores valores se verifican en la Argentina, el Uruguay,  Bolivia y Costa Rica (85%, 82%, 80% y 79% respectivamente), y los menores en Nicaragua, Honduras, el Salvador y Guatemala (46%, 51%, 55% y 56% respectivamente).
El segundo paso es analizar la relación entre la polarización y las identificaciones de clase.

La proporción de población que se sentía de clase media o media baja tendía a ser mayor en los países con una distribución del ingreso menos bipolarizada. Sin embargo, la asociación no es estadísticamente significativa, debido al comportamiento de El Salvador y Nicaragua, países donde los porcentajes de la población que se sienten de clase media son menores de lo que cabía esperar atendiendo a sus niveles de polarización del ingreso.

Se considera clase media a quienes señalaron pertenecer a la clase media o a la clase media baja.


Una hipótesis  es que las personas podrían tener una mayor propensión a definirse como de clase media en países con menos pobreza absoluta. En entornos con una menor incidencia de la pobreza podría incrementarse la probabilidad de que las personas se sientan de clase media, siempre y cuando se cumplan dos condiciones:
i) que crean que la clase media comienza una vez que han sido cubiertas las necesidades básicas de subsistencia o, alternativamente, cuando se supera un cierto umbral de pobreza, y ii) que exista una cierta cercanía conceptual entre  el concepto (y el umbral) de pobreza de las personas y el que se emplea en la medición monetaria.
El porcentaje de la población que se identifica como de clase media es significativamente mayor en los países donde la incidencia de la pobreza es más baja (por ejemplo, la Argentina, Uruguay y Costa Rica).

Esta asociación se sigue constatando al controlar la polarización y el PBI per cápita, y es
robusta a cambios en la especificación de los modelos. Los países donde los valores observados de identificación con la clase media se alejan más de los esperados son el Brasil, Nicaragua, el Estado Plurinacional de Bolivia y el Paraguay.

De cualquier modo, estos resultados deben evaluarse con cautela, puesto que existe el riesgo de correlaciones espurias. Adicionalmente, se podría cuestionar la validez de una medida de la clase media fundada en las evaluaciones de las personas, con el argumento de que predominaran las respuestas socialmente deseables (los altos porcentajes
de identificación con la clase media y media baja podrían ser interpretados como reflejos de esta tendencia).
Así, para establecer la validez del indicador de identificación con la clase media, se examinó la cercanía conceptual entre este y la evaluación que las personas hacen de su situación socioeconómica, y se exploró la relación entre el sentimiento de pertenencia a las clases sociales y algunas medidas habitualmente utilizadas para caracterizar externamente a las clases sociales.

Para el primer tipo de análisis se planteó la pregunta conocida como escala de Cantril, en que se pide a cada persona que valore su situación económica en una escala ordinal de pobreza-riqueza. En este caso no se emplearon los promedios como indicadores de bienestar, dado que son sensibles a los valores de la escala de respuestas, con
el agravante de que se pueden admitir distintos criterios de asignación de valores a esa escala (por ejemplo, los ordenamientos de bienestar basados en los promedios deberían ser distintos si se usa una escala en que se ponderen más los niveles de mayor riqueza en lugar de una escala lineal). Por consiguiente, se prefirió emplear las medianas
como indicadores de bienestar económico, puesto que son robustas a las escalas de respuesta, al depender su valor solamente de la distribución acumulada de frecuencias

A partir de este esquema de análisis, se aprecia que en 16 de 18 países (un 89%) las personas de clase media baja evalúan más favorablemente su bienestar económico que quienes se identifican con la clase baja.
Este porcentaje disminuye al comparar las medianas de la clase media con las de la clase media baja (56%). A su vez, en 17 de 18 países el bienestar económico percibido es mayor entre quienes se identifican con la clase media (incluidas la clase media y la clase media baja).

La pregunta formulada en la encuesta  fue la siguiente: “Imagínese en una escala de 10 peldaños, en que en el 1 se ubican las personas más pobres y en el 10 se ubican las personas más ricas: ¿dónde se ubicaría Ud.?”.

Las expectativas de movilidad se pueden analizar examinando las diferencias entre la percepción del bienestar económico presente y el que se espera que alcancen los hijos. Una primera mirada a los datos indica que, en el promedio regional, las expectativas sobre el bienestar futuro de los hijos se basan en criterios más exigentes que los que aplican los entrevistados para evaluar su bienestar presente. Así, el 42% de las personas encuestadas creen que sus hijos tendrán un bienestar económico que superará el quinto peldaño de la escala de pobreza-riqueza, mientras que solo el 29% evalúa su bienestar económico presente por encima de ese peldaño
Las preguntas utilizadas en la encuesta fueron la siguientes: “Imagínese en una escala de 10 peldaños, en que en el 1 se ubican las personas más pobres y en el 10 se ubican las personas más ricas: ¿dónde se ubicaría Ud.? ¿Y dónde cree Ud. que se encontrarán sus hijos?”.

Se observa que, en el promedio regional, las expectativas sobre el bienestar de los
hijos son más altas entre quienes se identificaron con la clase media y menores para quienes afirmaron ser de clase baja. Un 53% de la población que se consideraba de clase baja creía que el bienestar económico de sus hijos no superará el cuarto peldaño de la escala de Cantril, mientras que un 47% esperaba que sus hijos disfrutaran de un
nivel de vida superior al representado por ese peldaño. Entre quienes dijeron ser de clase media baja, un 37% creía que sus hijos alcanzarían un bienestar económico no superior al cuarto peldaño de la escala de pobreza-riqueza, mientras que entre quienes se identificaron con la clase media, solo opinaba así el 23%.En 8 de los 18 países estudiados las expectativas sobre el futuro de los hijos superan las valoraciones del bienestar presente y, por tanto, expresan expectativas de movilidad intergeneracional. En los restantes
países no hay diferencia, lo que denota expectativas de mantenimiento (reproducción) de la posición en la estructura socioeconómica. En esta situación se encuentran principalmente los países con mayores tasas de pobreza (o con un menor desarrollo social relativo), aun cuando hay excepciones, como el caso del Uruguay.


Rubén Weinsteiner

#BigData en tiempo real en el #votojoven


Rubén Weinsteiner


Rubén Weinsteiner


En 2009 estalló una nueva gripe que combinaba las cepas de la gripe aviar y la gripe porcina. La Ciencia la llamó H1N1 y se expandió rápidamente.

Los ministerios de salud de todos los países del mundo, preveían una epidemia complicada, que se iba a propagar velozmente.

Algunos la comparaban la gripe de 1918, la gripe españolaque afectó a 500 millones de personas y que causó decenas de millones de muertes.


La paranoia cundía en todos lados, la gente no iba al cine, muchos comenzaron a usar barbijos, los padres estaban aterrorizados por sus hijos. No había ninguna vacuna disponible.


La estrategia de los ministerios de salud de los diferentes países era lentificar la propagación. A eso aspiraban de máxima. Pero para ralentizarla necesitaban saber donde estaban los focos.


En EE.UU. los Centros de Control y Prevención de enfermedades, pedían que los médicos alertaran ante cada caso nuevo de la nueva gripe.

Entre que la persona se sentía mal, pasaban unos días, recién ahí iba a una guardia médica, y el mecanismo burocrático de detectar los síntomas, confirmar la gripe, preparar los informes y procesar la información, (la CDC clasificaba una vez por semana) hacía que entre la aparición de cada caso y la confirmación pasaran 2 semanas.

Con una epidemia así dos semanas es muchísimo.

Los gobiernos estaban desbordados, se desató una histeria mundial.


La solución apareció desde Google. Desde la compañía le explicaron al gobierno de EE.UU. que Google podía identificar rápido y en tiempo real, los focos de la gripe, no sólo en EE.UU. sino en todo el mundo.

Google recibe casi 4000 millones de búsquedas diarias, las archiva todas, y puede identificar desde donde viene cada búsqueda y clasificarlas por tema.


Google puso como parámetros los síntomas de la enfermedad y podía establecer desde donde y cuantas personas buscaban en Google, cosas que estuvieran relacionadas con los síntomas de la gripe H1N1.


Google tomó como parámetro las búsquedas durante otras epidemias gripales parecidas. Había muchas búsquedas que eran hipocondría pura. Pero al cruzar búsquedas dentro de los grandes números de la Big Data, empezaron a identificar los focos de propagación. Para eso utilizaron 450 millones de modelos matemáticos para identificar los focos más consistentes, y de esa manera identificaron 45 palabras de búsqueda que tenía una correlación directa con los focos que iba confirmando la CDC.

Google no sólo que detectaba los focos, sino que lo hacía en tiempo real.


Big data es dedo en el pulso en tiempo real, es tener todos los datos, no una muestra, es poder operar con todos esos datos, y es poder plantar, pescar y buscar respuestas.


La Big Data representa un cambio disruptivo en lo que hace a cuantificar y comprender comportamientos. Una inmensa cantidad de cosas que hasta acá no podían medirse, almacenarse, analizarse, compartirse y utilizarse.


Hasta acá nos manejábamos con el muestreo, ahora tenemos todos los datos y los podemos manejar.

Con la Big Data podemos predecir con precisión a través de la correlación de una enorme cantidad de datos.

Las redes sociales nos dicen que hacen, que les gusta, adonde van, a quien quieren y a quien no, millones de jóvenes. No hace falta encuestarlos, la Big Data está ahí. Es oro para los que estudiamos los sistemas de preferencias de los jóvenes.


Todo esto en tiempo real, midiendo humores, tendencias, demandas, insatisfacciones, rechazos, con el dedo el pulso segundo a segundo.

Que decir, donde, como, cuando, a través de que medios.

Con la Big Data obtenida en la Web social se puede microsegmentar y afinar el discurso, microsegmentar las piezas publicitarias, explorar deseos, miedos, demandas, ya no desde la extrapolación de una muestra, sino de la totalidad de los datos.


Rubén Weinsteiner

Generation Z Looks a Lot Like Millennials on Key Social and Political Issues


 Rubén Weinsteiner

Among Republicans, Gen Z stands out in views on race, climate and the role of government


No longer the new kids on the block, Millennials have moved firmly into their 20s and 30s, and a new generation is coming into focus. Generation Z – diverse and on track to be the most well-educated generation yet – is moving toward adulthood with a liberal set of attitudes and an openness to emerging social trends.

On a range of issues, from Donald Trump’s presidency to the role of government to racial equality and climate change, the views of Gen Z – those ages 13 to 21 in 2018 – mirror those of Millennials.1 In each of these realms, the two younger generations hold views that differ significantly from those of their older counterparts. In most cases, members of the Silent Generation are at the opposite end, and Baby Boomers and Gen Xers fall in between.2

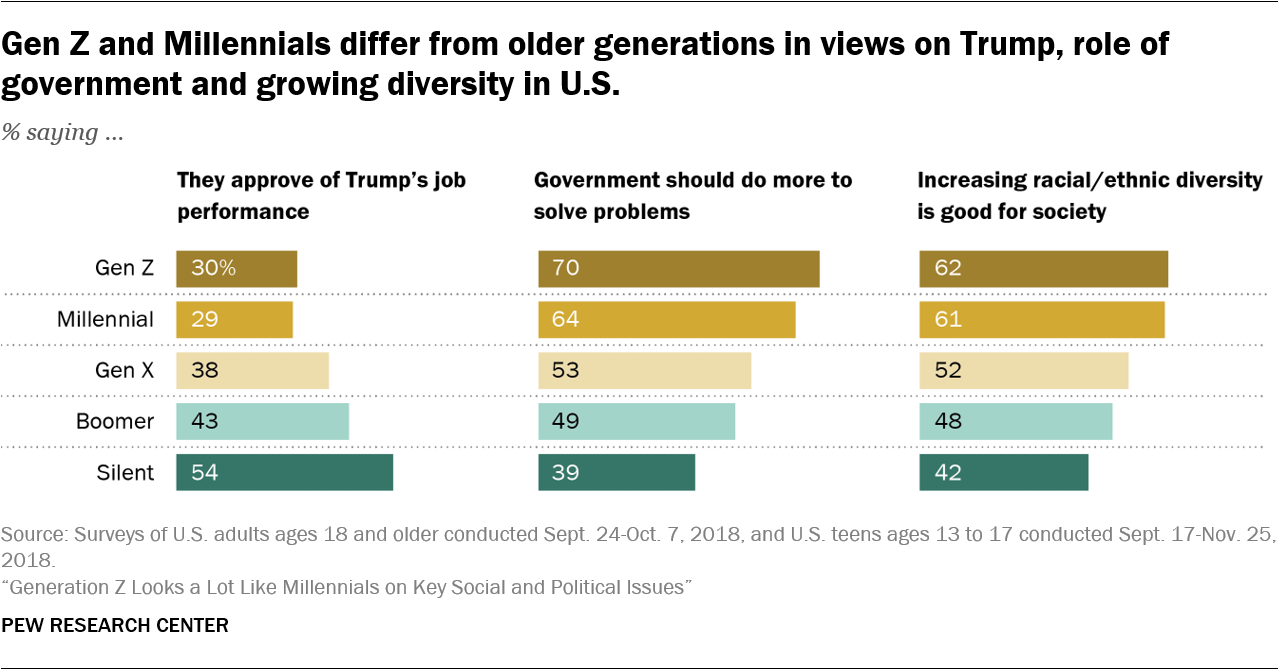
It’s too early to say with certainty how the views of this new generation will evolve. Most have yet to reach voting age, and their outlook could be altered considerably by changing national conditions, world events or technological innovations. Even so, two new Pew Research Center surveys, one of U.S. teens ages 13 to 17 and one of adults ages 18 and older, provide some compelling clues about where they may be headed and how their views could impact the nation’s political landscape.

Only about three-in-ten Gen Zers and Millennials (30% and 29%, respectively) approve of the way Donald Trump is handling his job as president. This compares with 38% of Gen Xers, 43% of Boomers and 54% of Silents. Similarly, while majorities in Gen Z and the Millennial generation say government should do more to solve problems, rather than that government is doing too many things better left to businesses and individuals, Gen Xers and Boomers are more evenly divided on this issue. For their part, most Silents would like to see a less activist government.

When it comes to views on race, the two younger generations are more likely than older generations to say that blacks are treated less fairly than whites in the United States today. And they are much more likely than their elders to approve of NFL players kneeling during the national anthem as a sign of protest.

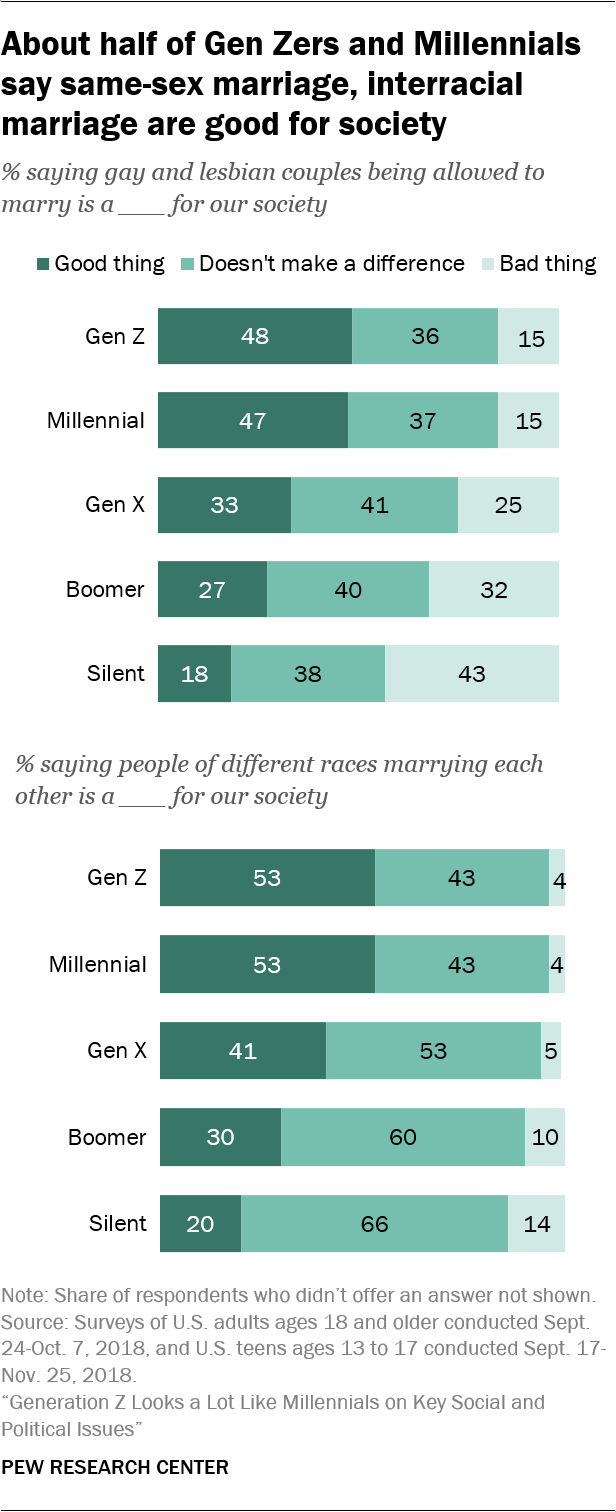
The younger generations are also more accepting of some of the ways in which American society is changing. Majorities among Gen Z and the Millennial generation say increasing racial and ethnic diversity in the U.S. is a good thing for society, while older generations are less convinced of this. And they’re more likely to have a positive view of interracial and same-sex marriage than their older counterparts.

As a recent Pew Research Center report highlighted, Gen Z is the most racially and ethnically diverse generation we have seen, but this isn’t all that’s driving the attitudes of this generation when it comes to issues surrounding race and diversity. There are significant, if more modest, generational differences on these issues even among non-Hispanic whites.
Roughly a third of Gen Zers know someone who uses gender-neutral pronouns

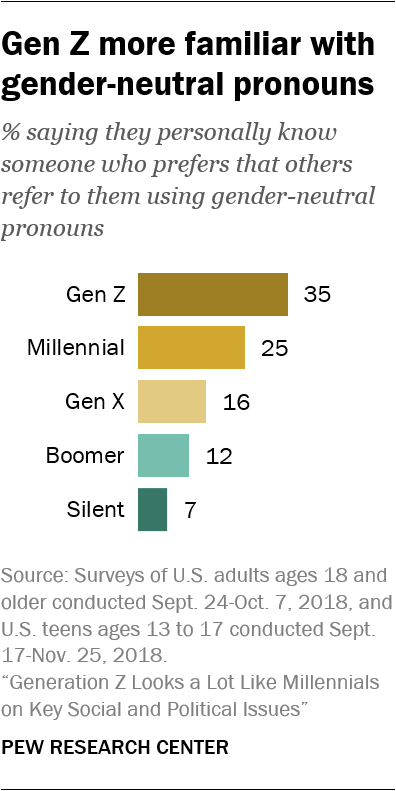
While Generation Z’s views resemble those of Millennials in many areas, Gen Zers are distinct from Millennials and older generations in at least two ways, both of which reflect the cultural context in which they are coming of age. Gen Zers are more likely than Millennials to say they know someone who prefers that others use gender-neutral pronouns to refer to them: 35% say this is the case, compared with a quarter of Millennials. Among each older generation, the share saying this drops: 16% of Gen Xers, 12% of Boomers and just 7% of Silents say this.

The youngest generation is also the most likely to say forms or online profiles that ask about a person’s gender should include options other than “man” or “woman.” Roughly six-in-ten Gen Zers (59%) hold this view, compared with half of Millennials and four-in-ten or fewer Gen Xers, Boomers and Silents.

These findings seem to speak more to exposure than to viewpoint, as roughly equal shares of Gen Zers and Millennials say society should be more accepting of people who don’t identify as either a man or a woman.

Members of Gen Z also stand out somewhat in their views on the role social media plays in modern news consumption. These teens and young adults are much less likely than older generations to say the fact that more people are getting their news from social media is a bad thing for society – 39% of Gen Zers hold this view, compared with about half among each of the older generations.
Among Republicans, Gen Z stands out on some key issues

While they are young and their political views may not be fully formed, there are signs that those in Generation Z who identify as Republican or lean to the Republican Party diverge somewhat from older Republicans – even Millennials – in their views on several key issues. These same generational divides are not as apparent among Democrats.

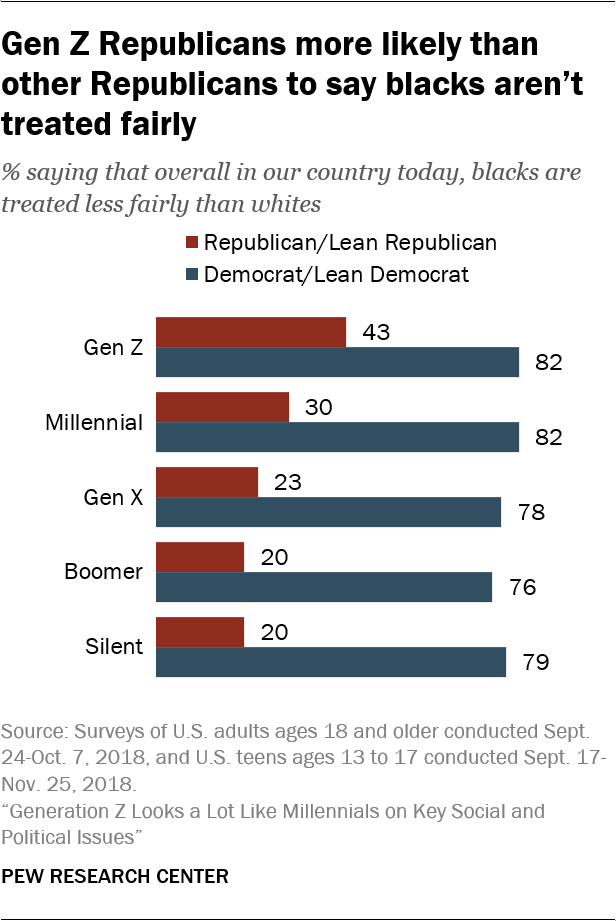
On views about race relations, Gen Z Republicans are more likely than older generations of Republicans to say that blacks are treated less fairly than whites. Among Republicans, 43% of Gen Zers say this, compared with 30% of Millennials and roughly 20% of Gen Xers, Boomers and Silents. Gen Z Republicans are also much more likely than their GOP counterparts in older generations to say increasing racial and ethnic diversity in the U.S. is a good thing for society. On each of these measures, Democrats’ views are nearly uniform across generations.

In addition, the youngest Republicans stand apart in their views on the role of government and the causes of climate change. Gen Z Republicans are much more likely than Republicans in older generations to say government should do more to solve problems. And they are less likely than their older counterparts to attribute the earth’s warming temperatures to natural patterns, as opposed to human activity.

While younger and older Americans differ in many of their views, there are some areas where generation is not as clearly linked with attitudes. When it comes to the merits of having more women running for political office, majorities across generations say this is a good thing for the country. Majorities in each generation also say that, on balance, legal immigrants have had a positive impact on the U.S.

This analysis is based on a survey of 920 U.S. teens ages 13 to 17 conducted online Sept. 17-Nov. 25, 2018, combined with a nationally representative survey of 10,682 adults ages 18 and older conducted online Sept. 24-Oct. 7, 2018, using Pew Research Center’s American Trends Panel.3 Findings based on Generation Z combine data from the teens survey with data from the 18- to 21-year-old respondents in the adult survey.
Gen Zers and Millennials share views on politics and policy; large generational gaps among Republicans

When it comes to views on political issues and the current political climate, younger generations have consistently held more liberal views than older generations in recent years. Today, members of Generation Z hold many similar views to Millennials, and both tend to be more liberal than older generations.

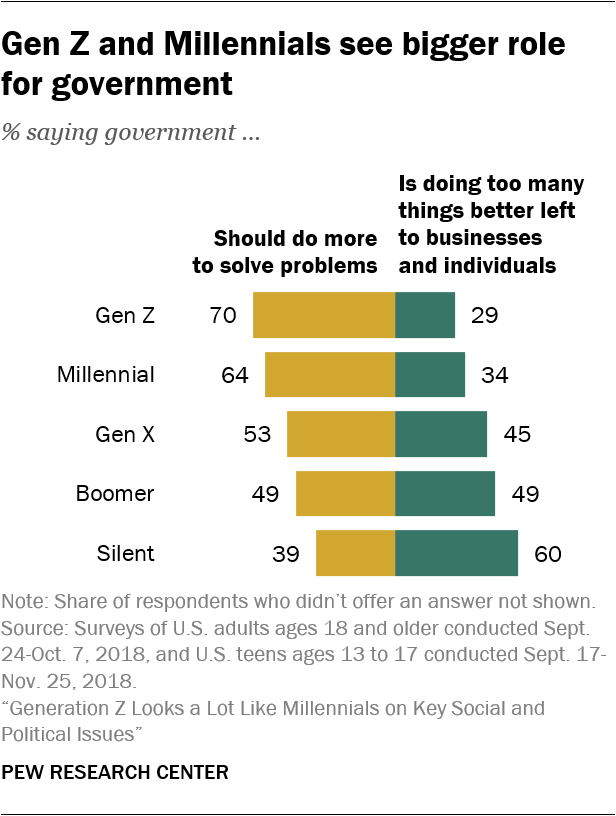
Seven-in-ten Gen Zers say the government should do more to solve problems in this country, while just 29% say the government is doing too many things that are better left to individuals and businesses. Gen Zers are slightly more likely to favor government activism than Millennials, and significantly more likely than older generations: 53% of Gen Xers, 49% of Baby Boomers and 39% of Silents favor government involvement over businesses and individuals.

Among Republicans and those who lean to the Republican Party, the generational divides are even starker. Roughly half (52%) of Gen Z Republicans say they think the government should be doing more to solve problems, compared with 38% of Millennial Republicans and 29% of Gen Xers. About a quarter of Republican Baby Boomers (23%) and fewer GOP Silents (12%) believe the government should be doing more.

Among Democrats, however, these generational divides largely disappear. Roughly eight-in-ten Gen Z (81%) and Millennial Democrats (79%) say the government should do more to solve problems, as do about seven-in-ten Democratic Gen Xers, Boomers and Silents.

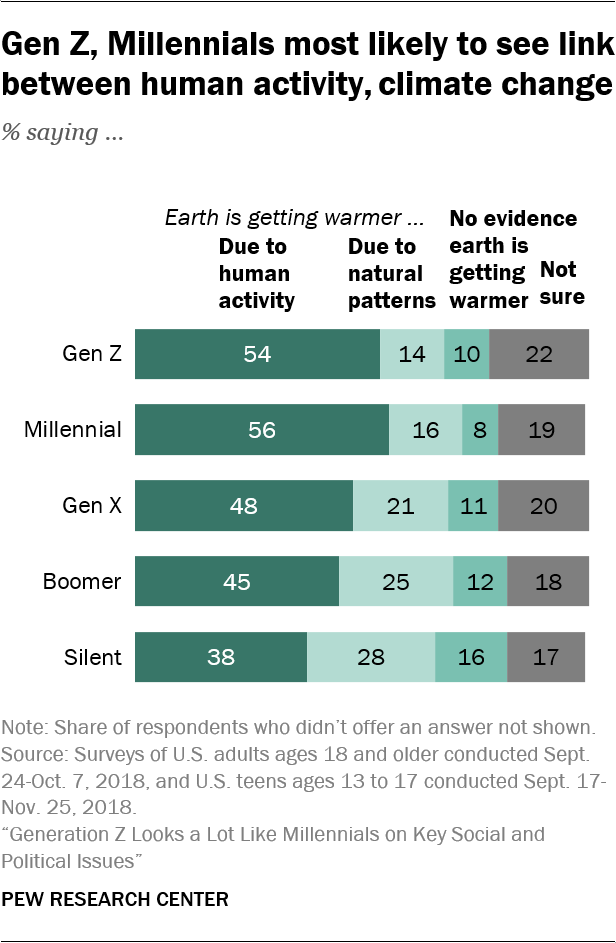
Gen Zers’ views about climate change are virtually identical to those of Millennials and not markedly different from Gen Xers. About half in all three generations say the earth is getting warmer due to human activity. Boomers are somewhat more skeptical of this than Gen Zers or Millennials. Members of the Silent Generation are least likely to say this (38%) and are more likely to say the earth is warming mainly due to natural patterns (28%) than are Gen Zers, Millennials and Gen Xers.

Among Republicans, Gen Z stands out from older generations as the least likely to say the earth is warming because of natural patterns – 18% say this. By comparison, 30% of Millennial, 36% of Gen X and roughly four-in-ten Boomer (42%) and Silent Generation Republicans (41%) say the same. Almost no generation gap exists among Democrats in views on this issue.

When it comes to views of Donald Trump, there are sizable generational divides, particularly among Republicans. Nine-in-ten Republicans in the Silent Generation approve of the job the president is doing, as do 85% of Baby Boomer Republicans and 76% of Gen X Republicans; smaller majorities of GOP Millennials (65%) and Gen Zers (59%) think he’s doing a good job.

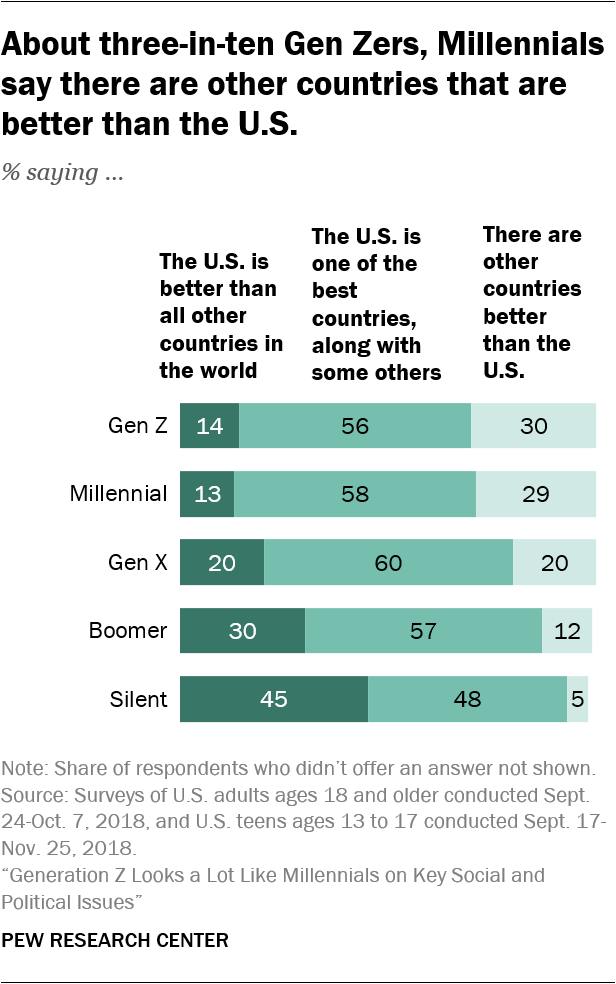
Younger generations also have a different view of the U.S. relative to other countries in the world. While pluralities of nearly all generations (with the exception of the Silent Generation) say the U.S. is one of the best countries in the world along with some others, Gen Zers and Millennials are the least likely to say the U.S. is better than all other countries. Only 14% and 13%, respectively, hold this view, compared with one-in-five Gen Xers, 30% of Boomers and 45% of Silents.

Roughly three-in-ten Gen Zers and Millennials say there are other countries that are better than the U.S.

In their views about the general direction of the country, Gen Zers are mostly downbeat, but they’re not alone in that assessment. Among Gen Zers, Millennials and Gen Xers, two-thirds or more say things in this country are generally going in the wrong direction. About six-in-ten Boomers (61%) say the same. Members of the Silent Generation have a less negative view (53% say things are going in the wrong direction).

Today’s 13- to 21-year-olds are only slightly more likely than Millennials to say ordinary citizens can do a lot to influence the government in Washington (53% of Gen Zers say this vs. 46% of Millennials). And their views on this issue don’t differ much from those of Gen Xers, Boomers or Silents (50%, 58% and 58%, respectively, say citizens can have a lot of influence on the government).
Stark generational gaps in views on race

Younger generations have a different perspective than their older counterparts on the treatment of blacks in the United States. Two-thirds of Gen Z (66%) and 62% of Millennials say blacks are treated less fairly than whites in the U.S. Fewer Gen Xers (53%), Boomers (49%) and Silents (44%) say this. Roughly half of Silents (44%) say both races are treated about equally, compared with just 28% among Gen Z.

The patterns are similar after controlling for race: Younger generations of white Americans are far more likely than whites in older generations to say blacks are not receiving fair treatment.

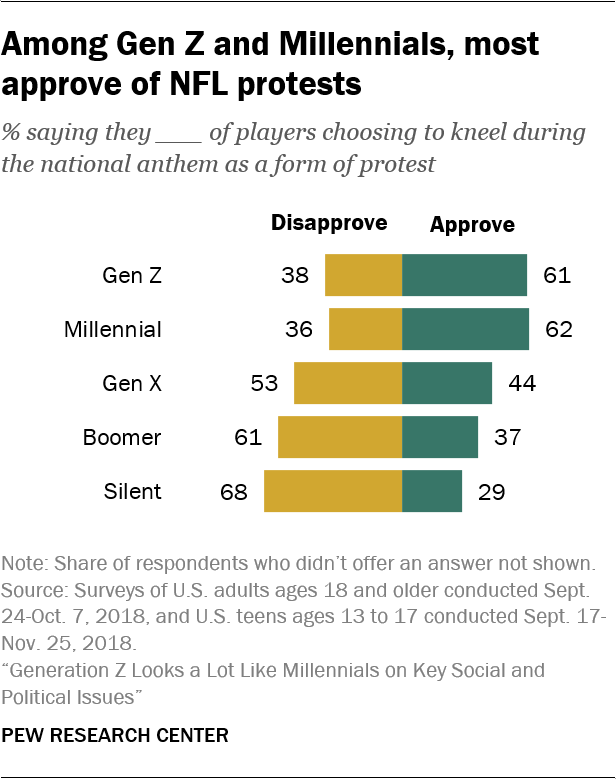
Younger generations also have a different viewpoint on the issue of NFL players kneeling during the national anthem as a protest. Majorities among Gen Z (61%) and the Millennial generation (62%) approve of the protests. Smaller shares of Gen Xers (44%) and Baby Boomers (37%) favor these actions. Members of the Silent Generation disapprove of the protests by a more than two-to-one margin (68% disapprove, 29% approve).

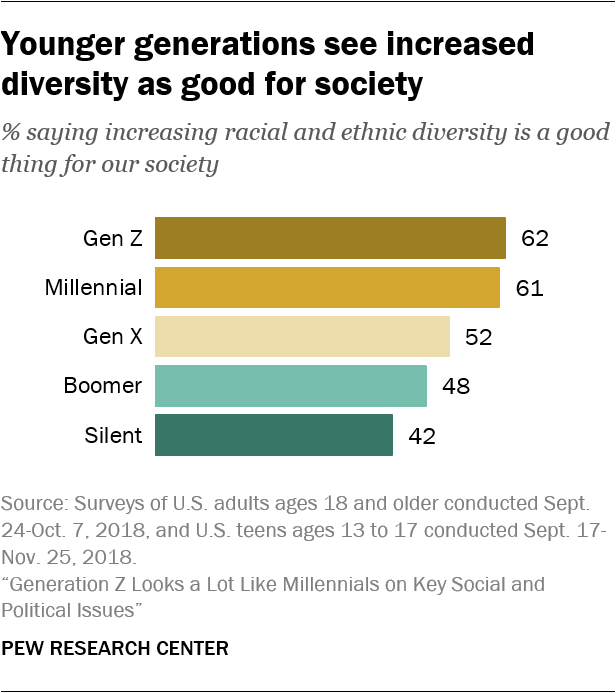
Gen Zers and Millennials share similar views about racial and ethnic change in the country. Roughly six-in-ten from each generation say increased racial and ethnic diversity is a good thing for our society. Gen Xers are somewhat less likely to agree (52% say this is a good thing), and older generations are even less likely to view this positively.

Younger Republicans again stand out in this regard. Half of Gen Z Republicans (51%) say increased racial and ethnic diversity is a good thing for the country. This compares with 38% of Millennial, 34% of Gen X, 30% of Boomer and 28% of Silent Generation Republicans. Among Democrats, there is widespread agreement across generations.

Though they differ in their views over the changing racial and ethnic makeup of the country, across generations most Americans agree about the impact that legal immigrants have on society. On balance, all generations see legal immigration as more positive than negative. Across most generations, Democrats are more likely than Republicans to say legal immigrants are having a positive impact. However, within Gen Z there is no partisan gap on this issue.

When it comes to views about how careful people should be in using potentially offensive language, members of Gen Z are divided over whether people need to be more careful or if concerns about political correctness have gone too far. Some 46% of Gen Zers say people need to be more careful about the language they use to avoid offending people with different backgrounds, while 53% say too many people are easily offended these days over the language that others use.

Gen Zers’ views are only modestly different from those of Millennials and Gen Xers on this topic: 39% and 38%, respectively, say people need to be more careful about the language they use, while about six-in-ten say people are too easily offended these days. Interestingly, members of the Silent Generation are closer to members of Gen Z in their views on this topic than they are to Boomers, Gen Xers or Millennials.
Gen Z and Millennials have similar views on gender and family

Since they first entered adulthood, Millennials have been at the leading edge of changing views on same-sex marriage. In 2014, when a narrow majority of all adults (52%) said they favored allowing gays and lesbians to marry legally, 67% of Millennials held that view. Today, members of Generation Z are just as likely as Millennials to say allowing gay and lesbian couples to marry has been a good thing for the country (48% of Gen Zers and 47% of Millennials hold this view). One-third of Gen Xers say this is a good thing for the country, as do 27% of Baby Boomers. Members of the Silent Generation are the least enthusiastic (18% say this is a good thing).

Relatively few Gen Zers or Millennials (15%) say same-sex marriage is a bad thing for society. Boomers and Silents are much more likely to view this change negatively (32% and 43%, respectively, say this is a bad thing). Across generations, about four-in-ten say allowing gays and lesbians to marry hasn’t made much of a difference for the U.S.

In other ways, too, Gen Zers and Millennials are similar in their openness to changes that are affecting the institutions of marriage and family. Roughly half (53%) from each generation say interracial marriage is a good thing for our society. Gen Xers are somewhat less likely to agree (41% say this is a good thing), and older generations are much less likely to view interracial marriage positively. Relatively few across generations say this trend is bad for society; majorities of Silents (66%) and Boomers (60%) say it doesn’t make much difference, as do 53% of Xers.

When it comes to couples living together without being married, roughly two-thirds of each generation (with the exception of Silents) say this doesn’t make much of a difference for society. About one-in-five Gen Zers and Millennials say cohabitation is a good thing for society – higher than the shares for older generations. Fully 41% of Silents say this is bad thing for the country, as do about a quarter of Boomers.

Compared with their views on cohabitation, the youngest generations have a more negative assessment of the impact of single women raising children: 35% among Gen Z and 36% of Millennials say this is a bad thing for society; roughly four-in-ten Gen Xers and Boomers and 48% of Silents say the same. About half of Gen Zers and Millennials say this doesn’t make much difference for society, while relatively few (15%) view it as a good thing.
Across generations, majorities say financial and child care responsibilities should be shared

In their views about gender roles within couples, members of Generation Z are virtually identical to Millennials and Gen Xers and quite similar to Baby Boomers. Large majorities in all four groups say that, in households with a mother and a father, the responsibility for providing for the family financially should be shared equally. About one-in-five Gen Zers, Millennials and Gen Xers – and a quarter of Boomers – say this responsibility should fall primarily on the fathers. Very few say mothers should be mostly responsible for this. Silents are the outliers on this issue: 40% say fathers should be mostly responsible for providing for their families financially, while 58% say this responsibility should be shared between mothers and fathers.

For the most part, there are no notable gender gaps in views on this issue; the Silent Generation is the exception. Among Gen Zers, Millennials, Gen Xers and Boomers, male and female respondents are largely in agreement that mothers and fathers should share family financial responsibility. Among members of the Silent Generation, roughly half of men (49%) but 33% of women say fathers should be mostly responsible for providing for the family financially.

Large majorities (84% or more) across generations say that responsibility for taking care of children should be shared by mothers and fathers in households with two parents. Some 13% among Gen Z say this responsibility should fall mainly to mothers; similar shares of each of the other generations say the same. Very few say raising children should fall mostly to dads. Male and female respondents across generations have similar views on this issue.
Widespread enthusiasm across generations for more women entering politics

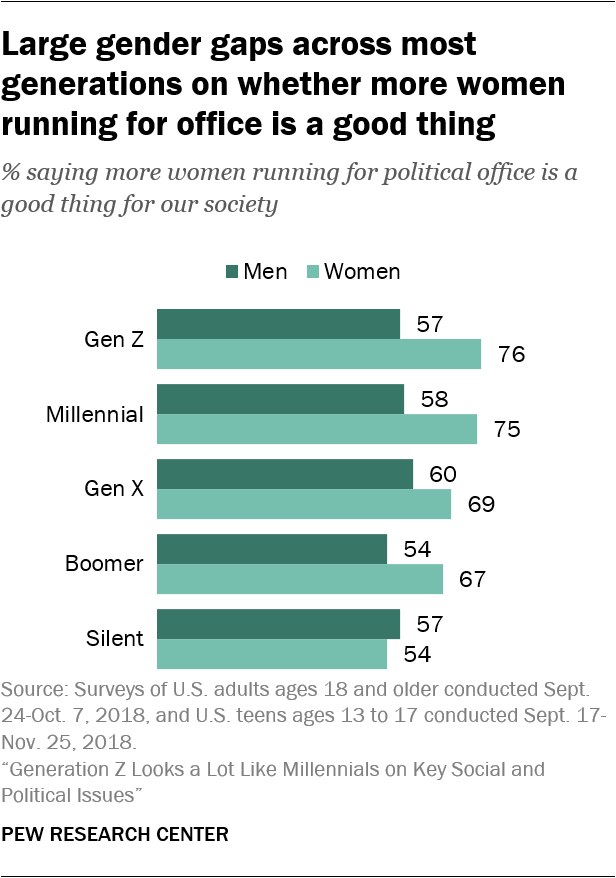
A majority of Americans, regardless of generation, view the increasing number of women running for public office as a positive change for our society. Roughly two-thirds of Gen Zers, Millennials and Gen Xers say this is a good thing, as do 61% of Boomers and 55% of Silents. About four-in-ten in the Silent Generation (39%) say this trend doesn’t make much difference for society, somewhat higher than the share among the three youngest generations (roughly three-in-ten).

There are significant gender gaps on this question, with female respondents expressing much more enthusiasm about the growing number of women running for office in each generation except the Silents. Among Gen Zers, 76% of young women, versus 57% of young men, say the fact that more women are running for office is a good thing for society. The pattern is similar for Millennials, Gen Xers and Boomers. However, among Silents, roughly equal shares of men (57%) and women (54%) say this is a good thing.
Gen Zers most likely to say forms or online profiles should offer gender options beyond ‘man’ and ‘woman’

The recognition of people who don’t identify as a man or a woman has garnered increased attention amid changing laws concerning gender options on official documents and growing usage of gender-neutral pronouns.

There are stark generational differences in views on these issues. Generation Z is the most likely of the five generations to say that when a form or online profile asks about a person’s gender it should include options other than “man” and “woman”; a 59% majority of Gen Zers say this. Half of Millennials say forms or online profiles should include additional gender options, as do about four-in-ten Gen Xers (40%) and Boomers (37%) and roughly a third of those in the Silent Generation (32%).

These views vary widely along partisan lines, with generational differences evident within each party coalition, but sharpest among Republicans and Republican-leaning independents. About four-in-ten Republican Gen Zers (41%) think forms should include other gender options, compared with 27% of Republican Millennials, 17% of GOP Gen Xers and Boomers and 16% of Republican Silents. Among Democrats and Democratic leaners, half or more in all generations say this, including 71% of Gen Zers and 55% of Silents.
Gen Zers and Millennials have similar views on treatment of people who don’t identify as a man or woman

When it comes to how accepting society in general is of people who don’t identify as either a man or a woman, the views of Gen Zers and Millennials differ from those of older generations. Roughly half of Gen Zers (50%) and Millennials (47%) think that society is not accepting enough. Smaller shares of Gen Xers (39%), Boomers (36%) and those in the Silent Generation (32%) say the same.

A plurality of the Silent Generation (41%) say society is too accepting of people who don’t identify as a man or woman. Across all generations, roughly a quarter say society’s acceptance level is about right.

Again, there are large partisan gaps on this question, and Gen Z Republicans stand apart to some extent from other generations of Republicans in their views. Among Republicans, about three-in-ten Gen Zers (28%) say that society is not accepting enough of people who don’t identify as a man or woman, compared with 20% of Millennials, 15% of Gen Xers, 13% of Boomers and 11% of Silents. Democrats vary little by generation in shares holding this view.
Generations differ in their familiarity and comfort with using gender-neutral pronouns

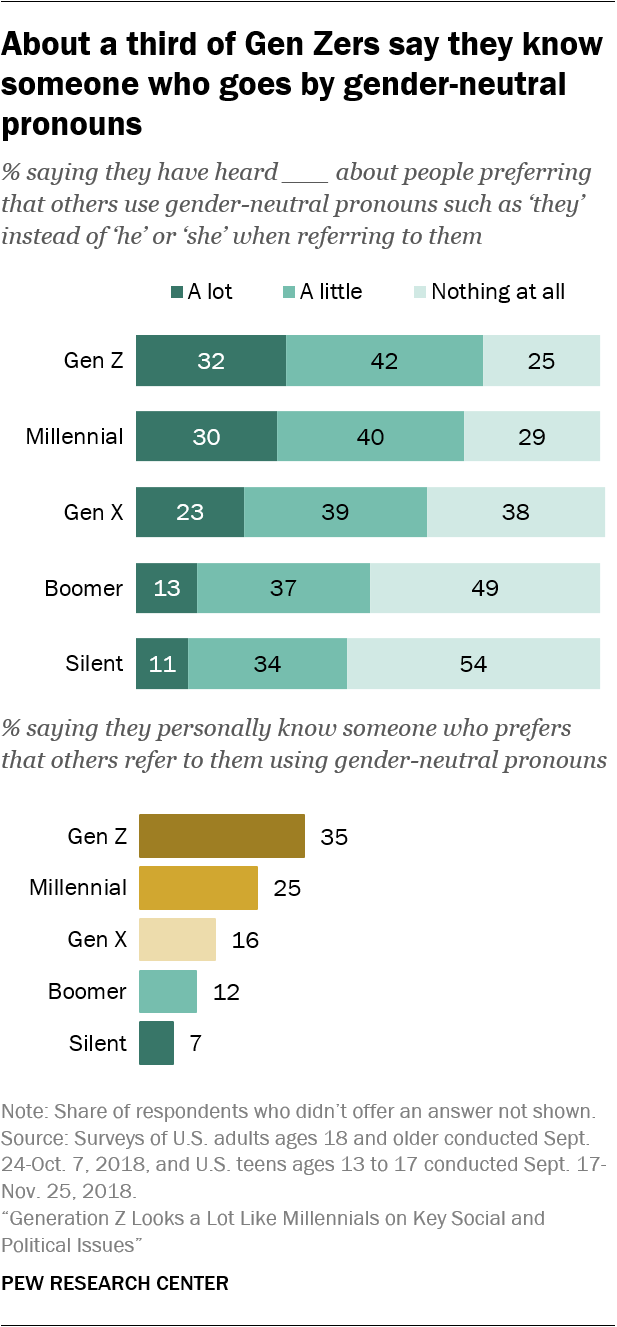
Gen Zers and Millennials are much more familiar than their elders with the idea that some people may prefer gender-neutral pronouns: 74% of Gen Zers and 69% of Millennials say they have heard “a lot” or “a little” about people preferring that others use gender-neutral pronouns such as “they” instead of “he” or “she” when referring to them, with about three-in-ten saying they have heard a lot about this. Most Gen Xers (62%) also have heard a lot or a little about people preferring gender-neutral pronouns.

There is less awareness of this among older generations. Still, half of Boomers and 45% of Silents say they have heard at least a little about gender-neutral pronouns.

Gen Zers are also the most likely among the five generations to say they personally know someone who goes by gender-neutral pronouns, with 35% saying so, compared with 25% of Millennials. Each of these younger generations is more likely than Gen Xers (16%), Boomers (12%) and Silents (7%) to say they personally know someone who prefers that others use gender-neutral pronouns when referring to them. This generational pattern is evident among both Democrats and Republicans.

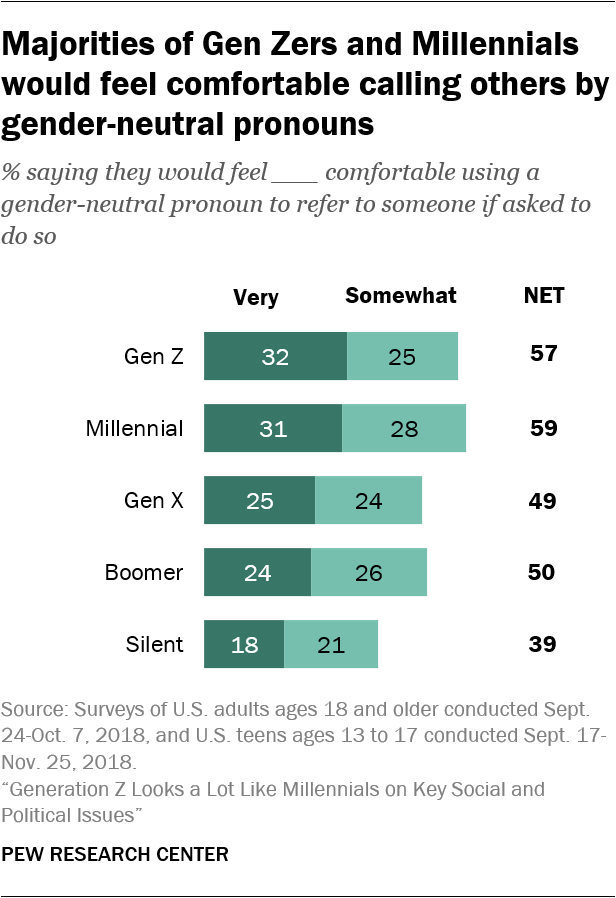
In addition to their greater familiarity with gender-neutral pronouns, Gen Zers and Millennials express somewhat higher levels of comfort with using gender-neutral pronouns, though generational differences on this question are more modest. Majorities of Gen Zers (57%) and Millennials (59%) say they would feel “very” or “somewhat” comfortable using a gender-neutral pronoun to refer to someone if asked to do so, including about three-in-ten (32% of Gen Zers, 31% of Millennials) who say they would be very comfortable doing this. By comparison, Gen Xers and Boomers are evenly divided: About as many say they would feel at least somewhat comfortable (49% and 50%, respectively) as say they would be uncomfortable.

Silents are the only group in which more say they would feel uncomfortable (59%) than say they would feel comfortable (39%) using a gender-neutral pronoun to refer to someone.

There are wide party gaps on this measure across generations. Within each generation, Democrats come down on the side of feeling comfortable, rather than uncomfortable, using a gender-neutral pronoun to refer to someone if asked to do so. In contrast, for each generation of Republicans, majorities say they would feel uncomfortable doing this.

Across generations, knowing someone who goes by gender-neutral pronouns is linked to comfort levels in using these pronouns. Three-quarters of Millennials and about two-thirds of Gen Zers, Gen Xers and Boomers who personally know someone who goes by gender-neutral pronouns say they would feel very or somewhat comfortable referring to someone with a gender-neutral pronoun. Those who don’t know someone are roughly 20 percentage points less likely to say the same (51% of Gen Zers, 54% of Millennials, 46% of Gen Xers and 48% of Boomers who don’t know someone say this).

Rubén Weinsteiner

Narrativa emocional en el #votojoven: que te escuchen y que te voten

Hablar con los jóvenes es fácil, que te escuchen no tanto, y que te voten ... ese es el tema

Por Rubén Weinsteiner


En los segmentos jóvenes hay que hablar de las audiencias más que de uno mismo y vender sensaciones y emociones más que medidas y programas, Más que hablar de vos, hablar como vos, lo más unplugged posible, y dotar al discurso de emocionalidad, que plantee perspectivas de reason why, la autopista prometida en sí no tiene valor emocional, sí lo tiene el poder llegar a lugares lejanos rápido, poder ir a ver a tu novia y llegar en minutos, volver antes a casa a jugar con tu hijo, vender más, buscar un trabajo en otra ciudad.

Las marcas políticas pueden ocupar un lugar en la cabeza de los jóvenes, pero deben ocupar un lugar en el corazón de los jóvenes. La emocionalidad se consolida cuando se comparten experiencias vivenciales entre la marca política y los sujetos jóvenes, y se asegura así la permanencia de una experiencia determinada como disparador de significados, de la marca política.


Hablar con los jóvenes es fácil, que te escuchen no tanto. La comunicación entre una marca política y los sujetos de elección jóvenes, en medio de la disputa de sentidos, emociones y ofertas simbólicas, requiere por parte del receptor joven de una validación, donde el emisor, en este caso la marca política debe “ser parte”. Estamos hablando de algo más que pertenecer, ser parte es hacer algo juntos, atravesar una instancia colectiva, donde se compromete lo emocional.

El joven quiere ser parte de algo, revelar y ejercer pertenencia y pertinencia, compromiso hacia una agrupación o movimiento político, entorno de un grupo musical, de una tribu urbana, de un grupo de amigos, barra, banda, club, tribu de seguidores, fieles, creyentes.


Los jóvenes siempre esperan que algo ocurra, que algo cambie, que los represente, sentir consonancia. Los jóvenes quieren vivir emociones


Lograr llamar la atención y que se hable de vos es un objetivo fundamental, clave y primordial, pero aprovechar esa atención para decir cosas importantes, es todavía mucho más importante, y en esa instancia, hacer sentir cosas, es todavía más importante en los segmentos jóvenes.


La dinámica de la comunicación política con los segmentos jóvenes, se despliega entre políticos y ciudadanos ante audiencias de audiencias. En esa política simétrica donde se establecen conversaciones híper masivas, los posicionamientos emocionales requieren de narrativas emocionales.

El gran desafío de la narrativa de la marca política en el voto joven, es presentar de la manera más eficaz, la promesa emocional de la marca. Con argumentos se conquista la mente, con historias se conquista el corazón, los argumentos intervienen sobre la necesidad, las historias sobre el deseo, y el voto, en los segmentos jóvenes, se define por deseo.

La narrativa política puede y debe virtualizar realidades y escenarios, construir sentido y valores simbólicos. La narrativa política crea la realidad, la define, la explica y la hace sustentable.

Todo discurso significativo que pretenda interpelar al voto joven, tiene sentido solo si transita los límites, es crítico y se apoya en el cambio como paradigma. Si se refiere a conflictos, utopías, incumplimiento de las normas, forzado de la realidad y convocatorias a luchas contra poderes enormes con final abierto. En esas luchas la emocionalidad se convierte en una plataforma poderosa.

El poder político se construye y acumula en el mercado de las emociones, la cognitividad fundamenta, y la emocionalidad define el sistema de preferencias.

La construcción de esa narrativa para interpelar al voto joven es horizontal, se expone a la mirada, la modificación, el ataque, el apoyo y el compromiso de los jóvenes que ya no no son mudos como en los 90 donde la telepolítica era el escenario. En Argentina todo pasaba en la TV, en Hora Clave o en Tinelli, y para los políticos ser era aparecer, mientras que para la gente ser era parecerse a. En cualquier caso no se le puede responder a un televisor.


Esa narrativa emocional debe plantear una narrativa con drama, protagonistas y antagonistas, peligros, indignación, moraleja, anclajes visuales, auditivos y sensoriales, obstaculos,simbología y ritualidad, desenlace, esperanza etc..


La Historia de Obama


La historia de Barack Obama diseñada para la primera campaña, de 2008, comienza mas o menos así: Barack Obama fue criado por su madre soltera y sus abuelos, no tenían mucho dinero, le inculcaron valores, esos valores tradicionales de Kansas, donde nació.
El inicio plantea el escenario, las dificultades y valores, construyendo la expectativa del conflicto que se plantea de movida. Es negro en un mundo dominado por los blancos, es pobre, su padre ausente. Cuando aparece el conflicto, nos plantea la tensión: ¿como va a terminar esto?
Sigue la historia. Pidió prestamos para estudiar, terminó sus estudios y se fue a trabajar para iglesias cristianas en Chicago, ayudando a las comunidades que quedaron devastadas luego del cierre de las acerías. Volvió a estudiar un postgrado tomando préstamos. Al finalizar, desestimó ofertas económicas importantes de estudios de abogados muy reconocidos, para volver a Chicago y desarrollar acciones de militancia de afiliación para el partido Demócrata. Se unió a una pequeña firma de abogados, se hizo docente universitario, y guiado por su fe cristiana, se volvió muy activo en su comunidad.
La narrativa de Obama, nos plantea como el héroe se sobrepone a las dificultades, rechaza las tentaciones del camino corporativo a favor del trabajo social, tiene éxito y sin embargo no olvida sus raíces.
Se casa con la bella Michelle, y tienen dos hermosas hijas: Sasha y Malia, siendo estas personas lo que más ama y el reason why de su carrera. Música para los oídos del votante en EE.UU.

Esta historia conquistó al votante americano. Casas más, casas menos y 45 años de diferencia, JFK también presentó una narrativa que conquistó el corazón de los votantes, interpelando el deseo, eje instrumental del voto.
En el caso de Obama la pregunta específica a instalar fue: ¿cómo hizo para llegar hasta aquí, a pesar de las adversidades? La estrategia narrativa basada en el “american dream”, propuso un héroe que surgió de la nada, quiere y puede llegar a lo mas alto y está en los votantes, en su deseo y acción, hacer que eso pase.


La narrativa para interpelar al voto joven, además de ser emocional y unplugged, no debe ser auto referencial, la gente más que oírte hablar de vos, quiere oírte hablar como vos mismo. No quiere anécdotas sino realidad, autenticidad. Si se lanza un programa político o un producto comercial, más que hablar del programa o del producto habría que hablar sobre la gente para quien ese plan o ese producto, fueron pensados, comunicar sensaciones y establecer una conexión emocional eficaz.


Las marcas políticas y corporativas se vuelven mucho más eficaces a la hora de ocupar el imaginario de los microsegmentos jóvenes, colonizar subjetividades, intervenir en su sistema de preferencias y sujetar a los sujetos de elección, si establecen una conexión emocional, exhiben su versión unplugged, y se conectan más con el deseo que con la necesidad del sujeto de elección joven.

#Votojoven: el discurso que construye poder quebrando el punto de vista de medios y periodistas


Por Rubén Weinsteiner

La juventud, comienza cuando se desarrolla la capacidad de reproducir la especie humana, y termina cuando se desarrolla la capacidad de reproducir el orden social.

Se es joven mientras se cuestiona, contesta y demanda cambios y se evita reproducir el orden social tal cual está planteado. Cuando se evita “transar”, cuando se quieren transponer límites, cuando se quiere forzar la realidad y enfrentar poderes constituidos y poderosos que frenan los cambios.


Uno de los poderes que más intervienen en la vida de los jóvenes es el poder mediático.

Las empresas mediáticas y los periodistas corporizan estrategias de negocios mientras crean sentido. Las empresas lo hacen por negocios más grandes, los periodistas por pauta o negocios más modestos.

En ambos casos la construcción de sentido se da produciendo construcciones mediáticas para lograr un lugar de enunciación que los posiciona dominando los acontecimientos que narran, con una ilusión de totalidad, que hace quienes consuman esos medios, “no necesiten” consumir más mensajes, hurgar en otras fuentes, o poner en duda lo desde esos medios comunica estos enunciadores globales para “conocer toda la realidad”.


Estos virtualizadores de realidades, y constructores de percepciones, instalan discursos hegemónicos y dominantes.

Por discurso hegemónico y dominante, entendemos, un sistema de referencias semióticas compuesto por un conjunto de signos ideológicos con un determinado valor, en torno de los cuales giran todas las demás significaciones sociales potencialmente válidas, y determinan no sólo los valores de verosimilitud de las nuevas producciones de signos sino también la verosimilitud de estos.


Estos emisores pujan por la construcción de representaciones, percepciones, imágenes del mundo que no son el mundo y creencias.

Los jóvenes por funcionalidad acotan el poder de fuego de medios y periodistas porque dieron por liquidado el brodcasting y operan con el pullcasting. Es decir rechazan la pasividad de quedarse inmóvil frente al televisor, y prefieren tener el control ellos y ver tramos de programas en you tube o escucharlos en radiocut, cuando ellos quieren, y resignificarlos, socializarlos y viralizarlos.

El discurso para interpelar a los diferentes segmentos jóvenes debe situarse en los limites. Hay que forzar la realidad que los medios intentan construir para impactar a los jóvenes y lograr su atención, empatía, interés y confianza.

Todo discurso significativo que pretenda interpelar al voto joven, tiene sentido sólo si transita los límites, es crítico y se apoya en el cambio de punto de vista como paradigma. Si se refiere a conflictos, utopías, incumplimiento de las normas, forzado de la realidad y convocatorias a luchas contra poderes enormes con final abierto.

El enfrentamiento para lograr los cambios, contra poderes hasta el momento “intocables” e “invulnerables”, le otorga vitalidad y dinamismo al vínculo, entre una marca política y los jóvenes. Ese final abierto, esa asimetría desfavorable, indignan, emocionan, convocan y le dan sentido a la bronca originaria y movilizadora, y la alegría de la acción y compromiso colectivos.

El cuestionamiento a medios y periodistas que construyen agendas corporizando negocios, contribuye a construir el nuevo campo de la mirada en los jóvenes. Es la puja por ordenar las percepciones sobre lo que realmente pasa, y de estructurar una narrativa propia, despojada de los intereses de empresas y periodistas y a organizar el debate, en torno a temas más reales y cercanos a los jóvenes.

Solamente en el terreno del cuestionamiento de los medios y emergencia de las contradicciones del discurso del mainstream, el mensaje hacia el voto joven adquiere su máxima tensión y con ella la potencia y significación plenas.

El discurso hacia el voto joven, debe quebrar el punto de vista de medios y periodistas para hacerse poderoso, para generar confianza, credibilidad, empatía y adhesión entre los jóvenes. Ese punto de vista construido a favor de la corporización de negocios políticos o corporativos, a través de procesos de standarización, limites y estereotipia de los mensajes de los medios, estructurados siempre con mecanismos repetitivos, que en realidad se constituyen como un control destinado a evitar la irrupción de mensajes nuevos y disruptivos.

Rubén Weinsteiner

Taking Sides on Facebook: How Congressional Outreach Changed Under President Trump

By Rubén Weinsteiner

Democratic legislators’ opposition on Facebook spiked after Trump’s election, while angry reactions increased among all congressional Facebook followers

The 2016 presidential election coincided with substantial shifts in the ways that members of Congress communicated with their constituents online. A new Pew Research Center analysis examines congressional Facebook posts from Jan. 1, 2015, through Dec. 31, 2017, a three-year timespan that includes the entire 114th session of Congress, the 2016 primary and general elections, the first year of the 115th Congress, and Republican President Donald Trump’s first year in office. The analysis finds that Democrats expressed political opposition nearly five times as much under Trump as they did during the last two years of Barack Obama’s presidency. Much of this opposition was directed at President Trump, though Democrats also increasingly opposed Republican members of Congress.

Terminology

Meanwhile, congressional Republicans posted in support of Trump more than twice as much as congressional Democrats posted in support of President Obama during his final two years in office (researchers did not have access to posts from Obama’s first year in office).2

Members of Congress who expressed political opposition most often were also the most liberal or conservative.3 This pattern is in line with the Center’s previous research on how members of Congress express political disagreement. But the new analysis also shows that the most ideological members were also the most likely to express support for others in their party. In other words, the most liberal and conservative members of Congress both attacked those on the other side more often and were more likely to affirm their own side’s decisions and positions. Moderates, meanwhile, tended to focus most of their posts on local issues.

Changes occurred not only in what members posted, but also in how their online audiences responded. The Facebook audience increasingly expressed angry reactions when responding to congressional posts. In early 2016, Facebook introduced alternatives to the traditional “like” reaction – and between late February 2016 and Election Day, just 2% of all reactions to posts used the “angry” option. But by the end of 2017, 9% of all reactions to posts by Democrats and 13% of reactions to posts by Republicans were angry.

Nearly universally, both supportive and oppositional posts about Trump or Obama drew more engagement – including likes, comments and shares – than posts about other topics. But the pattern was somewhat different for Hillary Clinton. Congressional posts that supported her drew the same number of likes as posts that did not take sides either way, while posts opposing her received 93% more likes on average – the largest increase in likes across all the kinds of posts examined here.

The new analysis used a combination of human coders and machine learning techniques to examine both the changing nature of congressional Facebook outreach and the way Facebook audiences responded to varying kinds of messages. To create the dataset, researchers studied more than 700,000 posts from 599 members of Congress during a three-year period surrounding the November 2016 election and Trump’s first year in office, beginning Jan. 1, 2015, and ending Dec. 31, 2017. Among the key findings:
After Trump’s election
Change of tone for Democrats after Trump took office: Following Trump’s inauguration, the share of Democratic legislators’ Facebook posts that included oppositional language – defined here as posts that oppose or disagree with the actions, decisions or positions of Trump and his administration or Republicans and conservatives – peaked in March 2017 at an average of 33% of all of their posts before ramping down to 24% toward the end of the year. That compares with an average of 12% of Republican lawmakers’ posts expressing opposition to Democrats and liberals or Obama during the last two years of his presidency. Democratic opposition during Obama’s presidency – at that point mostly aimed at congressional Republicans – appeared in just 6% of their Facebook posts.
Republicans expressed more support for Trump in his first year than Democrats did for Obama in the previous Congress: Just 4% of the average congressional Democrat’s Facebook posts from January 2015 through December 2016 expressed support for Obama. In contrast, the average Republican member expressed support for Trump in 9% of their Facebook posts in 2017.
After the election, the Facebook audience was far more likely to use the “angry” reaction to respond to outreach: Between Feb. 24, 2016 (when the reactions were first made available to Facebook users) and Election Day, 2% of all Facebook reactions to congressional posts were angry. But after the election through the end of 2017, that share tripled to 6%.4 By December 2017, the average was 9% for posts by Democrats and 13% for posts by Republicans.
During the 2016 campaign
Members of both parties focused more on Clinton than Trump during the 2016 campaign: Both presidential candidates drew modest attention from members of Congress on Facebook, and then-candidate Trump received less support from members of his party than Clinton did from hers. Between each party’s convention and Election Day, Democrats in Congress posted in support of Clinton substantially more often (a total of 1,614 posts) than Republicans posted in support of Trump (a total of 690 posts). However, Republicans opposed Clinton in 2,041 posts, far more than Democrats expressed opposition to Trump (1,383 posts).
Consistent patterns
Moderates went local, while very liberal and very conservative members took sides: Moderates in Congress were less likely to express political support or opposition than were very liberal or conservative members. The majority of moderates’ outreach focused on local issues (54%, compared with 38% for the most liberal or conservative members). Those in the middle of the ideological spectrum issued statements of political support and opposition about half as often as those on either end of the ideological spectrum.
More online followers engaged when elected officials took sides, especially when opposing individuals on the other side: Across the full time frame of the study, congressional posts that opposed Obama, Trump or Clinton earned more likes, comments and shares than posts that didn’t take sides either way. Posts that expressed support for politicians also received more engagement some of the time, but the pattern was not always consistent.

This analysis is based on 737,598 Facebook posts issued by 599 members of Congress between Jan. 1, 2015, and Dec. 31, 2017. The total number of legislators is greater than 535 (the current number of voting officials in the U.S. House and Senate) because members who were newly elected in the 115th Congress or in special elections are included in the study, as long as they produced at least 10 posts within a given Congress.

Researchers included both official Facebook accounts (those managed by congressional staff) and unofficial accounts (those used in a personal or campaign capacity) for members of Congress in this analysis. They did so in order to capture a more complete range of outreach on social media than would be possible with official accounts alone. As a result, the study includes a total of 1,129 accounts belonging to the 599 individual legislators.

Official accounts are used to communicate information as part of the member’s representational or legislative capacity, and U.S. Senate and House members may draw upon official staff resources appropriated by Congress when releasing content via these accounts. Unofficial accounts – often used in a personal and campaign capacity – may not draw on these government resources under official House and Senate guidelines. Members posted more often on official accounts across the study period: 76% of the average member’s posts came from their official account (for Democrats, the share was 78%; for Republicans, it was 75%).

To classify the posts, Pew Research Center manually analyzed a subset (11,000 total) of all the posts, classifying each post’s contents for the events, topics and issues raised or discussed in each one. Specifically, the analysts coded each post based on whether it expressed disagreement with presidents, candidates or parties; expressed support for the same; or mentioned local events, places or people. Next, researchers trained machine learning algorithms to make predictions – based on what the human coders reported – in order to classify the content of the entire set of posts.

How researchers classified more than 700,000 posts

While Facebook is one important part of members’ media outreach efforts, members also communicate with their constituents through press releases, town hall meetings, media appearances and on other social media outlets. Although this report does not examine communication across all these channels, Facebook posts constitute a useful way to compare members’ communication, as they can be systematically captured and analyzed. Previous research suggests that statements that members of Congress express on Facebook are similar in many ways to those they make in press releases. Focusing on Facebook posts also makes it possible to measure how much a member’s audience interacts with their posts via likes, comments and shares. Facebook is the most widely used social media website (excluding YouTube) and the social media site from which most Americans get news.


Democrats posted more and expressed more opposition after Trump took office

Shortly after Election Day 2016, Democratic members of Congress became more active on Facebook, posting more frequently than Republican members for the first time since at least January 2015. And in those posts, they expressed more than twice as much political opposition – directed at both President Trump and Republicans – than Republican legislators expressed on Facebook toward Obama and Democrats during the last two years of his term. Researchers tracked congressional rhetoric on Facebook beginning in 2015.
Democrats posted more under Trump than under Obama; Republicans posted less

In 2017, Democrats in Congress started posting more often, while Republicans posted less. The average Democrat posted 33% more often during the 115th Congress than in the 114th, going from 34 posts per month to 45 posts per month. Republicans posted less often, from an average of 42 to 37 posts per month.

Cumulatively, these changes have had a substantial impact on the total volume of Facebook posts being produced across all members of Congress in each party. Democratic members in the 115th Congress produced over 34,000 more Facebook posts across 2017 than they averaged in each year of the 114th Congress. In contrast, Republicans produced over 25,000 fewer posts in 2017 than they averaged during the previous two years.

How members of Congress expressed support and opposition
Democratic focus of opposition shifted from Trump to Republicans in late 2017

Overall, 30% of the average Democrat’s posts in 2017 contained some form of opposition toward Trump, Republicans or both. At the outset of the new administration, the majority of this opposition was directed at the president. Out of all the oppositional posts that the average Democrat produced in 2017, 71% of those posts targeted Trump, while 41% targeted Republicans more generally (some targeted both).

However, throughout Trump’s first year in office, Democrats shifted their focus away from the president, choosing to target their opposition toward Republicans with increasing frequency. By the end of the year, Democratic Facebook posts were more likely to express opposition toward Republicans than Trump. In December 2017, 70% of Democratic posts that expressed opposition were directed at Republicans, while only 43% of oppositional posts targeted the president.

These patterns parallel an increased appetite for political conflict among legislators’ Democratic constituents. From 2017 to 2018, the percentage of Democrats in the U.S. public who said they like elected officials who make compromises with those they disagree with dropped from 69% to 46%.

Across the study period, Republicans focused on President Obama in 82% of oppositional posts on average (8% of all posts by the average lawmaker). A much smaller share of Republicans’ posts expressed opposition toward Democrats or Hillary Clinton (2% and 1% of all posts by the average lawmaker, respectively). This focus on Obama persisted after the election. Across 2017, statements opposing Obama and Obama-era policies like the Affordable Care Act were more common than those opposing Democrats. At the same time, throughout 2017, fewer than 1% of the average Republican’s posts expressed opposition to Clinton, despite some anecdotal reports to the contrary.
Very liberal and conservative legislators took sides; moderates went local

More liberal or conservative legislators – based on the DW-NOMINATE estimate of ideology – were about twice as likely to express either support or opposition toward other political figures and groups as compared with more moderate members.

Moderate members – defined as those that fell in the middle 20% of the roll-call-based ideology estimate – publicly opposed others in about 7% of posts, compared with a rate of about 16% for the most conservative or liberal members, defined as those in the most liberal tenth or most conservative tenth of the ideology measure. Moderates expressed support for the president or their party in roughly 5% of their Facebook posts, while the most liberal or conservative members did so in 10% of all their Facebook outreach.

During the 115th Congress, starting in January 2017 and including the inauguration of President Trump, the link between ideology and political opposition became even more pronounced among Democrats. For that Congress, the most liberal Democrats expressed opposition in 35% of posts on average, compared with 10% for moderates.

In contrast, while the most liberal and conservative members of Congress focused their rhetoric on expressions of political support and opposition, moderates disproportionately talked about local issues in their Facebook outreach. These posts, which draw attention to individuals, groups, and organizations in the state or district the member represents, made up more than half of all posts from the most moderate members of Congress, compared with about one-third of posts for those on each end of the ideological spectrum.

In general, members were more likely to cover these local issues than engage in other forms of outreach described here, including opposition to political opponents. Over the course of the full three-year study period, nearly half of congressional outreach on Facebook focused on local issues (45% of posts), compared with the 13% of all posts that expressed oppositional views. The average Republican focused on local topics in 48% of Facebook posts, compared with a rate of 44% for the average Democrat. Meanwhile, only 16% of posts from the average Democrat and 10% from the average Republican expressed opposition to the other side. Across both parties, the average legislator expressed support for others in their own party in 8% of posts.
During the 2016 campaign, members of both parties focused on Clinton

During the run-up to the 2016 election, Trump and Clinton drew modest attention from members of Congress on Facebook, and then-candidate Trump received less support from members of his party than Clinton did from hers. Between each party’s convention and Election Day, Democrats in Congress posted in support of Clinton substantially more often (a total of 1,614 posts) than Republicans posted in support of Trump (a total of 690 posts). However, Republicans opposed Clinton in 2,041 posts, far more than Democrats expressed opposition to Trump (1,383 posts).

Legislators also weighed in on the two candidates using both their unofficial and official accounts. In total, 154 (11%) of the 1,383 pre-election posts in which Democrats opposed then-candidate Trump came from legislators’ official accounts. Republicans leaned even more heavily on their official accounts when it came to candidate-focused election outreach, using those accounts to express opposition to Clinton in about one out of every four posts (26%) that did so across both account types (522 of 2,041 total posts). Congressional rules prohibit legislators from posting campaign-related content on their official accounts, but these restrictions may not apply to posts that mention political candidates outside the context of elections. Clinton was often discussed in the context of her role as secretary of state under President Obama, and Republican opposition to Clinton frequently focused on issues such as the attack on the U.S. Embassy in Benghazi, Libya, and the FBI investigation into her use of a personal email account as secretary of state. In contrast, posts by Democrats that opposed Trump focused on his role as a presidential candidate and public figure.


How the Facebook audience engaged with congressional posts

When members of Congress posted in support of or opposition to political candidates, their Facebook audiences engaged more compared with posts that did not. At the same time, an increasingly large proportion of “reactions” to congressional posts – a set of emoji introduced by Facebook in February 2016 to capture user’s responses – featured the “anger” reaction. Over the full range of the study, legislators’ Facebook audiences liked congressional posts over 481 million times, created more than 45 million comments in response to posts, and shared the posts over 141 million times. Those audiences also used the “angry” reaction more than 24 million times.

This analysis uses statistical models to examine how the presence of support or opposition in a Facebook post can affect the number of likes, comments and shares it receives. The models help account for other factors that could impact that post’s engagement, such as the number of followers a given post’s author has and when it was posted. See methodology section for additional details. All of the reported results are based on the entire three-year time frame.
The Facebook audience engaged with oppositional posts more than with ones that didn’t take sides

Posts opposing Presidents Trump and Obama and former Secretary Clinton drew more likes from Facebook audiences compared with posts that didn’t express political support or opposition. On average, posts opposing Trump received 53% more likes, posts opposing Obama received 54% more and posts opposing Clinton received 93% more likes. However, this pattern was more muted when posts opposed Democrats or Republicans more generally: Those posts received 32% and 12% more likes than posts that didn’t take sides. These findings parallel earlier research that examined the relationship between political disagreement and Facebook engagement.

Among posts expressing political support, the results were less consistent. Posts supporting Trump, Obama and Democrats received an estimated boost in likes of 56%, 38% and 21%, respectively, relative to a post that did not contain any support or opposition. But the boost in likes for posts that supported Clinton or Republicans was much smaller: 2% and 5%, respectively.7

The Facebook audience was also more likely to leave comments on posts that expressed either support or opposition than on posts that did neither. When it came to comments, oppositional posts were consistently more likely to result in comments than posts that expressed support. Posts that opposed Clinton received the largest boost in comments, garnering 171% as many comments as the average post that did not express either support or opposition. Similarly, posts opposing Obama and Trump received 155% and 113% more comments. Posts expressing support for Trump, Obama and Clinton received boosts in comments of 90%, 46% and 83%, respectively. A similar but less pronounced pattern emerged for posts opposing and supporting the two political parties.

When it came to Facebook shares, which refer to users reposting congressional posts for their own Facebook audiences, the difference between posts expressing opposition and posts expressing support was most pronounced. Posts that opposed Trump, Obama and Clinton received an estimated boost in shares of 141%, 155% and 225%, respectively. However, posts that expressed support for Trump or Obama received smaller increases, of 41% and 35%. And posts that supported Clinton actually received fewer shares than posts that did not take sides; a decrease of 33%. Posts supporting Democrats and Republicans also received fewer shares than posts that didn’t take sides, decreasing 26% and 9% of shares, respectively.
Angry reactions from the Facebook audience increased; posts expressing opposition received most anger

Legislators’ Facebook audiences became much more likely to react to posts with Facebook’s “angry” button in the wake of the 2016 election. Prior to the election (but after the “angry” feature was released), just 1% of all reactions to posts by Democrats were angry. After the election, that share increased to 5%, on average. Among Republicans, the share of angry reactions increased from 2% before the election to 6% after. While “likes” remain the most common reaction, “angry” was the most frequently used of the six alternatives (such as “haha,” “wow,” and “love”). This has not always been the case. Prior to Trump’s inauguration, the “love” reaction was the most commonly used alternative to “likes,” but it has since been largely eclipsed by “angry.” The use of angry reactions to congressional Facebook posts rose throughout 2017, reaching its highest observed rates at the end of the year, comprising 9% of all reactions to the average Democrat’s posts in December 2017, and 13% of the average Republican’s.

Angry reactions were especially likely to ensue when posts expressed political opposition. Posts that expressed opposition to Trump received an estimated five times as many angry reactions as posts that did not express support or opposition toward any figure or group. When Democrats expressed opposition to Republicans, they earned six times as many angry reactions, on average. Because the emotional reactions were not available across the entire timeframe, this analysis is based upon posts created between Feb. 23, 2016 (the day before the reactions were released) and Dec. 31, 2017.
Comments increased after Trump won 2016 election

In the wake of the 2016 election, legislators’ Facebook audiences became much more likely to engage online by posting comments. Across both parties, the average number of comments per post increased more than 200%, comparing the time period before the 2016 election with all posts created afterward.

Just as the use of angry reactions peaked in December 2017, the Facebook audience became more likely to post comments at the end of that year, averaging 125 comments per post. By contrast, in December 2015, the average post received just 65 comments. This pattern is even more pronounced when examining the median number of comments per post. That number more than tripled, from seven comments per post at the end of 2015 to 22 comments by December 2017.


Rubén Weinsteiner